

8. What is Coin Dow Theory? Charts and patterns
◆ Before explaining the Dow Theory
The Dow Theory is a theory created by Charlse Dow, the creator of the Dow Jones Industrial Index.
The principles of his theory are as follows.
◆ Average reflects everything
1. All well-known information in the market is reflected in the market, and even if an unexpected event occurs, it is immediately reflected in the market.
2. The reason why the stock price falls even when Samsung announces great earnings is that people buy in advance in anticipation of good earnings, and sell when they announce it. In other words, market movements are strongly influenced by expectations.
3. It should be more reliable to approach expected information from a probabilistic perspective through statistical analysis than to trade at the time of news.
◆ There is a trend in the market (short-term / medium-term / long-term)
1. There is a short/medium/long-term trend (TREND) in the market.
2. The existence of momentum has been scientifically proven.
3. The period can be defined differently for each individual manager, but less than 3 weeks is classified as short-term, 3 to 6 months as medium-term, and more than 6 months as long-term.
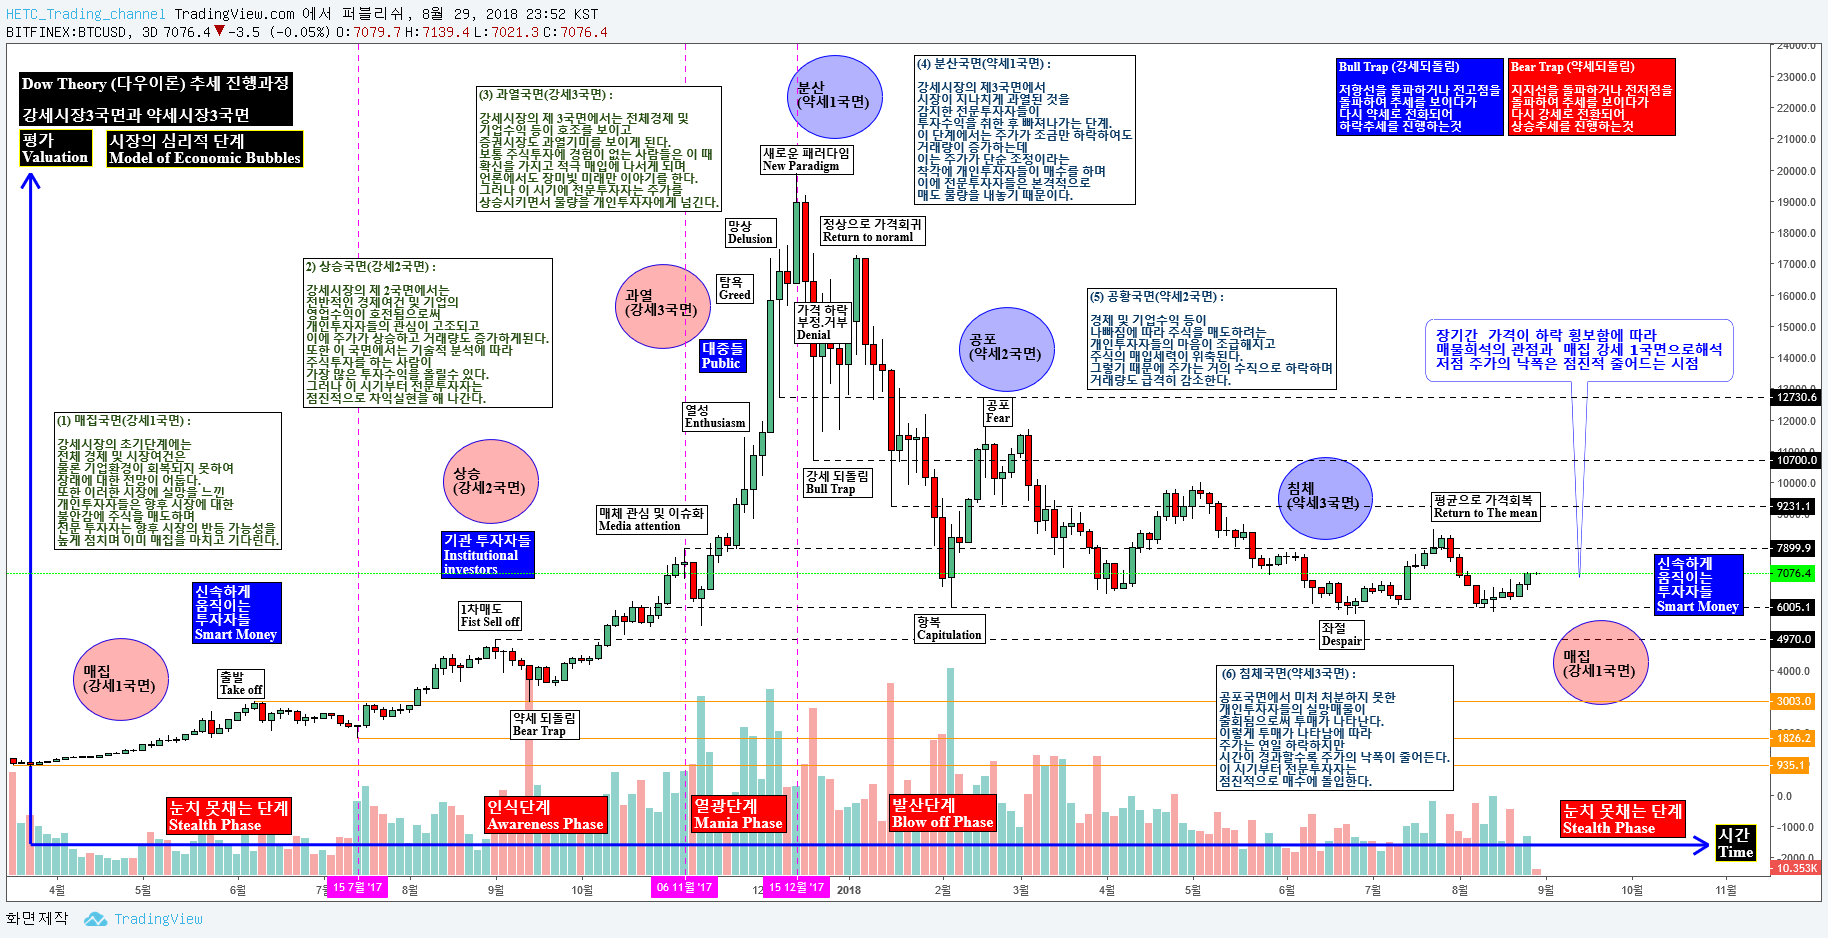
◆ There are three phases of the price trend (bullish / bearish / flat).
1. Accumulation: The market mood after a bear market is pessimistic, but smart traders/investors buy steadily before the price rises.
2. Public participation: More participants participate, and investors who have accumulated in advance buy more actively. Prices often fluctuate during this time.
3. Overheating & Dispersion - The public believes it will go higher, but the trend is almost over. Smart money accumulated in advance makes realized profit or loss to hold cash or distribute assets.
◆ It is correlated with indices
1. The Dow Theory initially expressed the correlation between the Dow Industrial Index and the Railroad Index.
2. It can be used as an indicator in investment by analyzing correlations based on the movement between the industry index and other indices or sectors.
◆ Volume provides useful information about market price trends.
1. A strong trend means that it should be accompanied by high volume.
2. The higher the volume, the more likely the movement will reflect the market trend.
3. If the trading volume is small, it may not reflect the market trend.
◆ Once a trend is formed, it will continue to be maintained until the direction is reversed.
1. The Dow believed that once a trend is formed, the market will remain in a certain direction until it reverses direction, and that a certain event/psychology will cause the market to reverse direction before breaking the trend.
출저 : https://www.tradingview.com/x/grMB79Va?utm_source=amp-version
|
2021년 해외코인거래소 순위 및 추천 |
|||
|
|
|
|
|
|
거래량 |
11조(1위) |
3.5조 |
9.5조 |
|
레버리지 |
최대100배 |
최대100배 |
최대125배 |
|
수수료 |
- 지정가 : 0.02% - 시장가 : 0.04%(1위) |
- 지정가 : -0.025% - 시장가 : 0.075% |
- 지정가 : -0.025% - 시장가 : 0.075% |
|
거래방법 |
현물+선물+마진 |
선물+주식+FOREX |
선물 |
|
회원가입
|
|||
|
할인코드
|
|||


