

6. How to read the Ichimoku Chart
◆ What is the Ichimoku Balance Table?
The Ichimoku Balance Table is a technique created by a Japanese investor named Immoksanin in 1935, and it contains the assertion of 'balance' in the sense that it predicts the current direction by figuring out the balance between the past and the future by holding the center of the current market price.
If you look at the actual Ichimoku Equilibrium trading method, most of the strategies are buying and selling after identifying the section where the equilibrium is broken, such as rising -> falling or falling -> rising.
◆ Elements of the Ichimoku Table
The Ichimoku balance table consists of a total of 5 elements. Then, the elements will be explained step by step starting from the transition line.
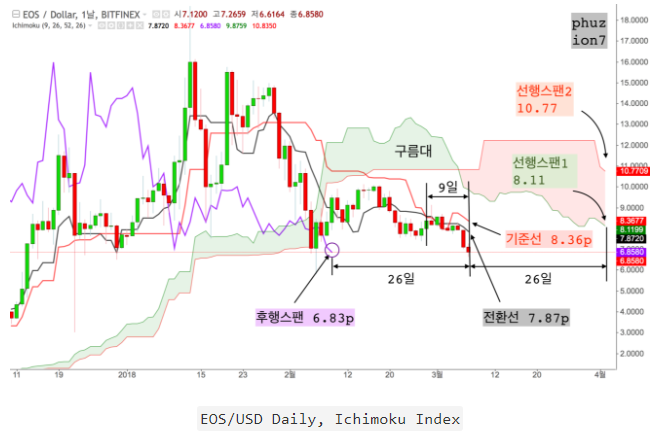
(1) Transition line
A similar concept to the short-term moving average line, the line connecting the median of the highest and lowest prices in the past 9 days including the same day with a line explains the balance of power between buying and selling.
Conversion value: 9 days (highest price + lowest price) / 2
(2) Baseline
Similar to the medium-term moving average line, it is a line connecting the median of the highest and lowest prices for the past 26 days including the same day with a line.
Baseline: 26 days (highest price + lowest price) / 2
(3) Trailing span
This is the line where the current stock price was recorded at a past position 26 days ago.
(4) Leading span 1
Leading span is a line for predicting the future based on the current movement by recording a certain section of the current stock price (26 days later) into the future.
Leading span 1 = of the day (conversion value + reference value) / recorded before 2, 26 days
(5) Leading span 2
Leading span 2 is the line recorded 52 days later, and the average of the 52-day high and low values was recorded 26 days earlier.
Leading span 2 = 52 days (highest + lowest) / 2,26 days before
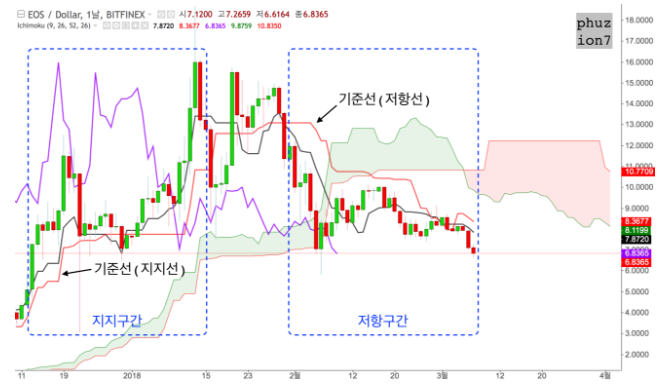
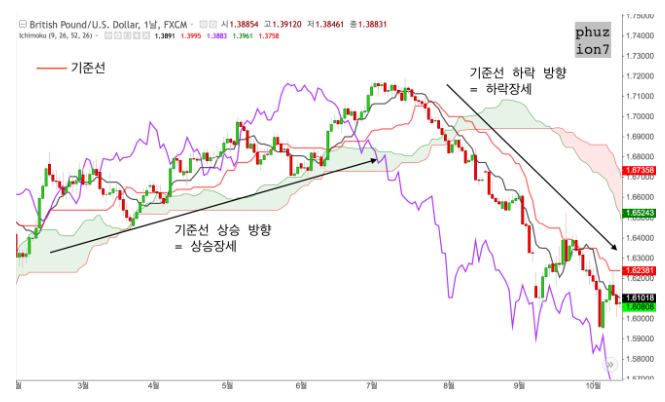
◆ Relationship between transition line and baseline
The transition line is a 9-day average, which can be interpreted as a short-term moving average, and the baseline is a 26-day average, which can be interpreted as a medium-term moving average.
The section where the short-term moving average crosses above the mid-term moving average is referred to as a 'golden cross' section, and is regarded as a rising signal.
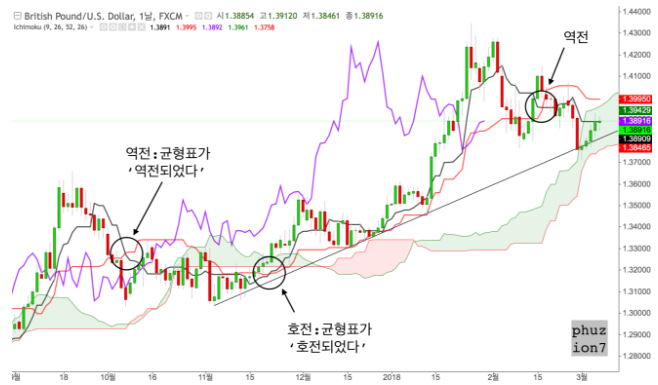
In the Ichimoku table, the 'Golden Cross' is ordered to be 'better', and the 'Death Cross' is expressed as a reversal.
◆ Examples of improvement and reversal
Bullish = Golden Cross (short-term moving average crosses above medium-term moving average)
Reversal = Death Cross (mid-term moving average breaking below short-term moving average)
In other words, in the Ichimoku Equilibrium table, an upturn can be interpreted as a golden cross, and a reversal can be interpreted as a death cross.
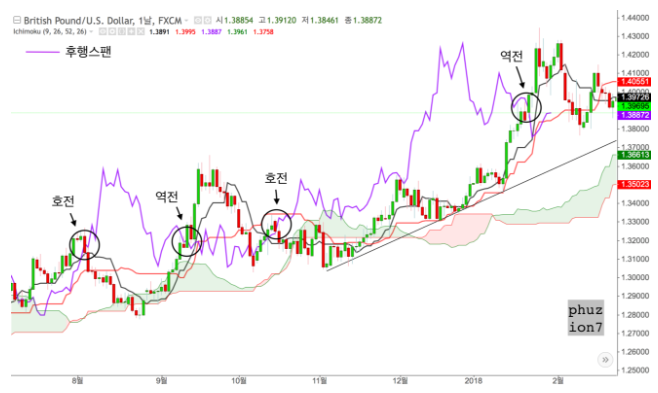
◆ Trailing span reversal and improvement
The right-hand span is the purple line in the image above, indicating the current stock price at the position 26 days ago. When the trailing span breaks the stock price upward from the bottom, it is regarded as an uptrend and considered a buy signal. Conversely, the trailing span lowers the stock price. If it breaks through and goes down, it is viewed as a downtrend and considered as a sell signal. (The principle is similar to the concept of golden cross and desk cross)
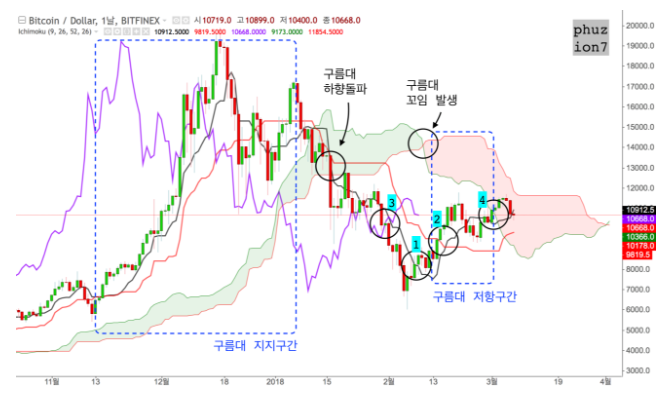
◆ Ichimoku Equilibrium Cloud vs. Trading Method
Finally, we have reached the clouds.
Gureumdae, the flower of Ichimoku Equilibrium trading, is called the Gureumdae between Leading Span 1 and Leading Span 2.
As you can see in the image above, the green cloud band is twisted and crossed into the red cloud band, and the twist point is a trend change.
At this time, the thicker the cloud belt, the higher the reliability. The auxiliary indicator required for this cloud belt chart is 'ichimoiku cloud', which is an English expression of the Ichimoku table. If you enter the English above in the chart table, the leading span 1, 2, and Available.
cf. Cloud Zone auxiliary indicator chart settings cannot be set in Bithumb, Upbit, and Vifa, but can be set through TradingView.
|
2021년 해외코인거래소 순위 및 추천 |
|||
|
|
|
|
|
|
거래량 |
11조(1위) |
3.5조 |
9.5조 |
|
레버리지 |
최대100배 |
최대100배 |
최대125배 |
|
수수료 |
- 지정가 : 0.02% - 시장가 : 0.04%(1위) |
- 지정가 : -0.025% - 시장가 : 0.075% |
- 지정가 : -0.025% - 시장가 : 0.075% |
|
거래방법 |
현물+선물+마진 |
선물+주식+FOREX |
선물 |
|
회원가입
|
|||
|
할인코드
|
|||


