

1. 1. Coin Exchange Chart Basics
We’re going to explain how to view the chart in general five times. We will start with the most basic positive and negative peaks slowly, so please read through it.
The coin chart uses Bitfinex by default, and let's start with the Bitfinex chart interface.
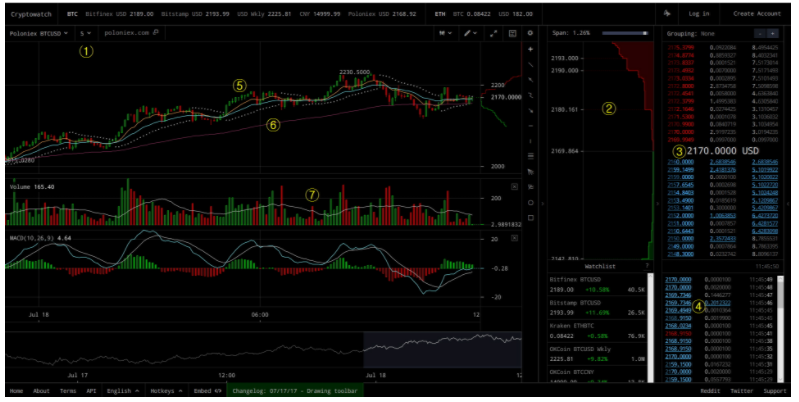
1.Time Stick
If you can't see the image above, please click it. If you look at No. 1 on the screen, you can see the setting of the hour bar. You can change the time bar to 1 minute, 5 minute, 15 minute, 30 minute, 1 hour, etc. Chart analysis may vary depending on how you look at it.
The most commonly seen peak is the 5-minute peak, and when viewed macroscopically, you can also see the 1-hour peak.
2.Market Depth
This refers to the volume. It refers to the size and distribution of the amount you want to buy or sell, and as the volume increases (wider), it says that the buying or selling trend is strong. Conversely, how much volume is added even in a downtrend can determine the confidence of the chart flow.
3.Price Window
This is the price window. If the market depth is displayed visually, the asking price window shows the exact amount and quantity you want to buy or sell.
4.Transaction Completion Window
This is the transaction completion window.
5.Candle Chart
The most frequently seen part of chart analysis is a candle chart. Also called a bar chart, it is a figure that connects market price fluctuations over a period of time with a bar.
6.Moving Average
After the candle charts, the moving average is often used in analysis. It is an important coordinate for reading the overall chart flow.
7.Volume Candle
If you can see the price change in the candle chart, the volume candle is a window where you can gauge the amount of buying and selling attached to the price fluctuation. It is similar to the previous volume chart.
|
2021년 해외코인거래소 순위 및 추천 |
|||
|
|
|
|
|
|
거래량 |
11조(1위) |
3.5조 |
9.5조 |
|
레버리지 |
최대100배 |
최대100배 |
최대125배 |
|
수수료 |
- 지정가 : 0.02% - 시장가 : 0.04%(1위) |
- 지정가 : -0.025% - 시장가 : 0.075% |
- 지정가 : -0.025% - 시장가 : 0.075% |
|
거래방법 |
현물+선물+마진 |
선물+주식+FOREX |
선물 |
|
회원가입
|
|||
|
할인코드
|
|||


