

2. How to view the bar chart and candle chart
Following how to view the Bitfinex chart interface in the previous time, you can see the candle chart, also known as the bar chart, which is the most basic for chart analysis. Time to buy/sell this.
There are two types of charts: positive bar and negative bar. Generally, the positive bar represents in red and the negative bar represents in blue. We will start with the positive (red) and the negative (blue) bars.

1.Positive and Negative Bar
A positive bar is the red bar when the price rises, and a negative bar is the blue bar when the price goes down. If you look at the image above, a tail appears on the chart and sometimes there is no tail. If the time starts above or below the starting price, you will have a tail.
Do you understand? This is not a formula and it has to be done naturally, and this is quite natural if you look at the Bitfinex or Bitmex chart and think about it. For example, if you call it a positive bar with a 5-minute bar, you can think of the price as rising for 5 minutes during that period. The negative peak is the opposite.
If you look at the left bar, there are tails up and down. You can think of it as a trace of the price movement during the 5-minute period. It is easy to understand how far it has fallen and how far it has risen.

2.Open and Closing Price
The left is positive and the right is negative.
A positive bar is the bar in which the market price rises. At this time, the words closing price (end price) and opening price (starting price) are used. If you think of the 5-minute bar, the price at which a new 5-minute bar is created is the opening price and the price at the end of the bar is the closing price. When it ends, it moves to a new bar.
If you think about the positive bar, since the market price has risen, it is normal that the ending price should be higher than the starting price, right? The lower end of the cancellation is the opening price, and the lower end of the cancellation is the closing price.
What about the tails on the top and bottom of the cancellation? It can be seen as a trace of the price movement for 5 minutes. The highest point is called high price and the lowest point is called low price, and the highest and lowest points of the price movement for 5 minutes are marked.
Then, if you look at the negative bar to the right, it is a negative bar with a falling market price. It is normal when the closing price (end price) is lower than the starting price. You can think of it as the opposite of the positive bar.
Words don't matter. This is a part that can be understood at the level of common sense while looking at the chart, but you can read it through first, and try to understand it by looking at the chart slowly.
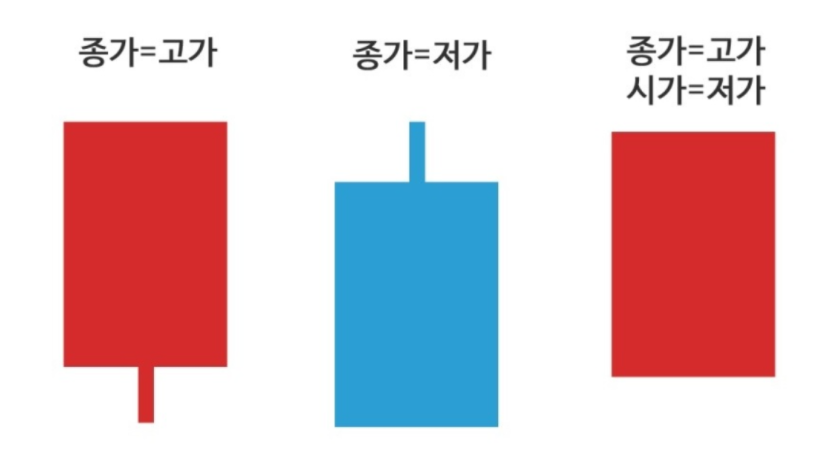
3.Application of Cancellation
The above cancellation has no tail unlike the previous cancellation. It is also easy to understand. In the case of the positive bar, if the closing price is the highest, there will be no tail, right? Conversely, if it is a negative bar, there will be no tail if the closing price is the lowest.
There are also cases where there is no tail. There is no trace of up or down during the period. In this case, the price continues to rise for 5 minutes. . Conversely, if there are several negative bars without tails, it is a chart with continuous decline.
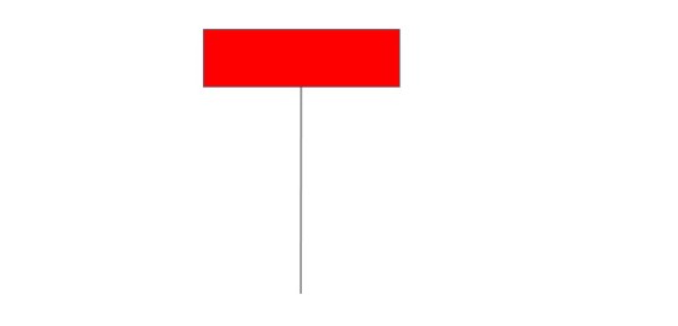
4.Hammer-shaped Cancellation
If you have learned the basics of positive and negative bar so far, now it is the application.
What does the positive bar above mean? Also known as hammer-shaped candle. It means the inflow of buying pressure to raise the market price by buying it at a low price. The current price is at the top, but looking at the tail that fell down, you can see that the price below has been raised as a trace before.
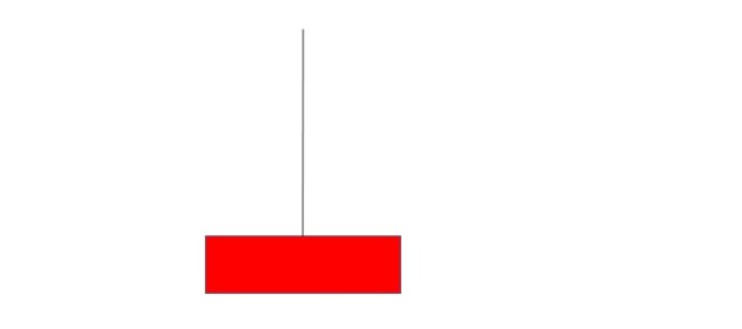
5.Inverted Hammer-shaped Cancellation
It is the opposite, with an inverted hammer-shaped cancellation.
The trace appears to have an upper tail, so it ran above the market price and then dragged it down.
|
2021년 해외코인거래소 순위 및 추천 |
|||
|
|
|
|
|
|
거래량 |
11조(1위) |
3.5조 |
9.5조 |
|
레버리지 |
최대100배 |
최대100배 |
최대125배 |
|
수수료 |
- 지정가 : 0.02% - 시장가 : 0.04%(1위) |
- 지정가 : -0.025% - 시장가 : 0.075% |
- 지정가 : -0.025% - 시장가 : 0.075% |
|
거래방법 |
현물+선물+마진 |
선물+주식+FOREX |
선물 |
|
회원가입
|
|||
|
할인코드
|
|||


