

6. Head and Shoulder pattern, chart
◆ What is a Head and Shoulders chart pattern?
The head and shoulder chart pattern helps traders identify reversals that will occur on the candlestick chart after the trend ends.
The bullish reversal caused a reverse head and shoulders. The chart is usually formed by a baseline with three highs. This pattern is usually a reversal signal at the end of an uptrend.
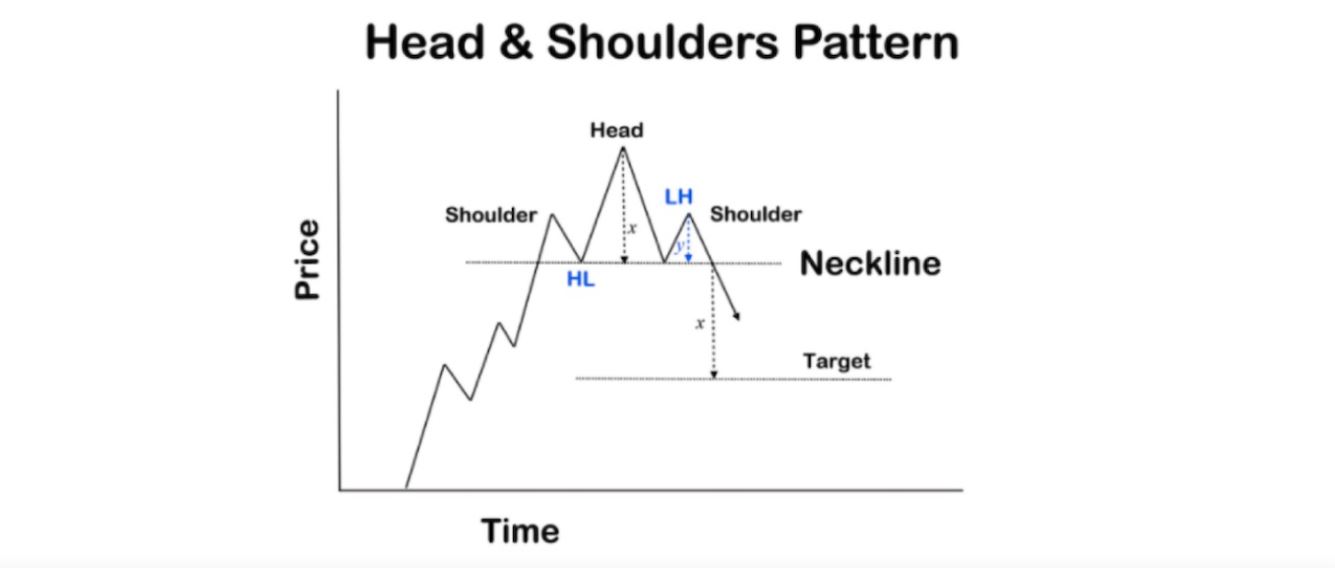
Have you ever wondered how this pattern got its name Head and Shoulders? It's not borrowing the name of a famous shampoo brand. The pattern actually resembles a head and two shoulders (left and right shoulder). There are basically 3 highs, the mid high is higher than the other 2, and the two lows should ideally be placed on the same line. This baseline is called the neckline and causes a bearish signal. So when the price drops below that, we are free to sell.
The Head and Shoulders pattern is one of the most popular chart patterns along with the double-barreled, double-bottomed, and triangular patterns. Traders consider this pattern to be one of the most reliable, providing a very strong signal. When combined with some technical analysis indicators, especially oscillators that show overbought levels, the pattern becomes more reliable.
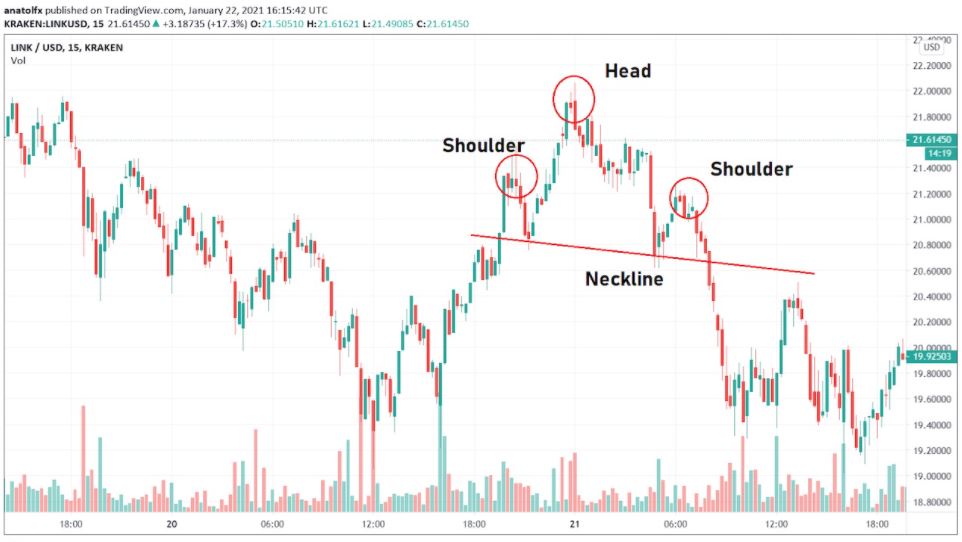
◆ Head and Shoulder Pattern Identification
It is very important to accurately identify the head and shoulders pattern. Otherwise, you can trade against the general trend. As we already know, the pattern has the following elements:
Left shoulder
Head
Right shoulder
Neckline triggering a bearish signal
The neckline is most often inclined in one direction or the other, but it is important to understand that it may not always be straight. In general, a lower slope will produce a more stable signal.
Components of the Head and Shoulders Pattern
There are several elements seen in the head and shoulders pattern. Understanding the components in a pattern is necessary to avoid confusion with other charts. Basically, a high (shoulder) is formed, followed by a higher high (head), followed by a lower high (shoulder). On the other hand, the neckline (neckline) is visible when the two lowest points of the two troughs join.
Here are some things to note:
Previous trend
The first thing to consider is the previous trend. The previous trend should be a bullish one. In general, the longer an uptrend lasts, the greater the chance of a reversal. A head-and-shoulders pattern is a sign that the bulls are not going any further.
Left shoulder
If it encounters some resistance, the uptrend will peak and then retreat briefly. After creating support, it potentially reverts to a continuous uptrend. I can't figure it out in real time, but this is how the left shoulder is formed. It may appear that the price is forming a double high.
Head (top)
While rebounding along the left shoulder, the price breaks through its previous highs, but faces another resistance. Despite the temporary rise, the trend cannot continue and the price falls for a second time, leaving higher highs behind. This is when the shoulder pattern is formed from head and shoulder.
However, the second pullback will end at the same level relative to the first support line. This is the neckline. At this point, we have the left shoulder and head of the pattern.
Right shoulder
As mentioned above, the second drop will meet strong support near the neck line and then the price will finally continue its upward trend. However, after facing resistance at the level where the first high was formed, price is retreating for the third time, let alone an uptrend. This long process suggests that the bullish movement has been exhausted.
The third high marks the right shoulder. Ideally, the left and right shoulders should be relatively level, but even with slight deviations, the pattern still holds.
Neckline
As defined earlier, the neckline differentiates bullish from bearish. This means that when the price drops below the support line, you can open a short position with high confidence.
◆ What is a reverse head and shoulder pattern?
Head and shoulders can also be formed in the opposite direction. An inverted head and shoulders signal that the chart pattern is following a bearish move and that the market is about to reverse.
As the name suggests, it is the same pattern, but formed backwards. So if you spot this pattern on the chart, you should be interested in starting a long position.
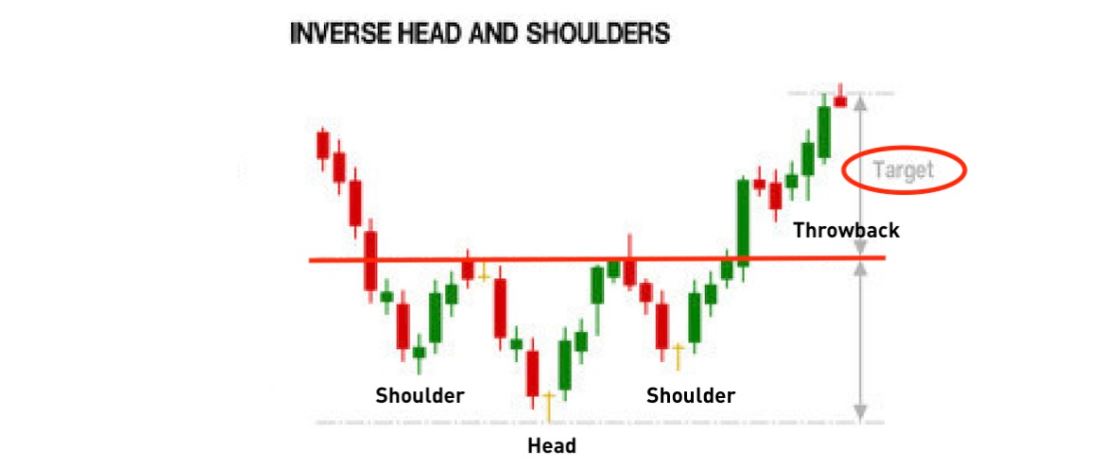
During the formation of the inverted head and shoulders, the first thing you will see is the first lower valley. After a relatively long downtrend, the price finds support and briefly rebounds. Eventually, it faces regional resistance, and the bear market briefly broke below the first low as it tried to lower the price.
The second valley is lower and represents an inverted pattern of the head. After forming the head, the price rebounds for a second time, but cannot break above the neckline (neckline), which currently serves as resistance. At this point, the market makes its third low and forms a second shoulder.
Finally, a bull market could break the resistance on a third attempt. Target prices are calculated similarly. You need to measure the distance between the neckline and the trough and then add the result to the breakout price to get the target price.
◆ Reverse Head and Shoulder Pattern Features
Head-and-shoulder patterns have a few key features to watch out for. Since the indicator must be in an uptrend, it is essential to define a previous trend. A simple moving average (MA) can be used for this.
Once an uptrend is confirmed and a head-and-shoulder pattern is found, there are a few more aspects to consider.
Trading volume
As the pattern unfolds, you should check the volume indicator, which is usually located below the chart. You can also draw other volume indicators on the chart. In general, you should pay attention to the specific behavior of your volume to make it more relevant to your head and shoulders pattern. Ideally, the volume should be higher while forming the left shoulder than during the head of the pattern. So, a drop in volume and a new high in the head suggest that the uptrend is weakening.
Next, ideally the volume should surge as the price forms the right shoulder and is about to drop below the neckline. If the volume surges with the breakout, you can be sure that the trend has reversed forever.
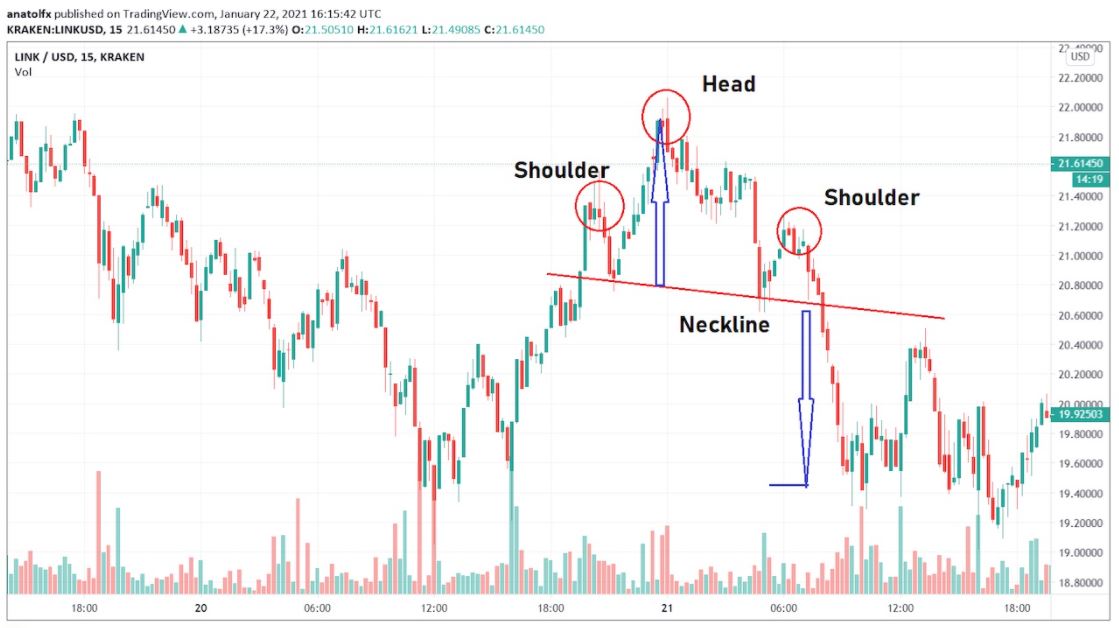
Target
A break below the neckline causes cryptocurrency traders to open short positions. The target price of the sell order comes from the distance between the neckline and the top of the head. So, after measuring the distance, subtract that distance from the breakout price to get an approximate target price.
However, the target may be influenced by several other factors, including pre-pattern support, long-term moving averages, or Fibonacci retracement lines.
Pattern signal
A head and shoulders chart pattern is a bearish pattern that appears while an uptrend is exhausted. So, treating it exclusively as a signal to go short will help. There is also an inverted head and shoulders pattern. An inverted head and shoulders pattern is a bullish signal.
Pattern timeline
The best thing about the Head and Shoulders pattern is that it can be used on different timelines. It is best for swing traders and can be a great help for day traders as well. Fast-paced strategies like scalping don't fit this pattern well. In general, if you're using a timeline larger than the M15, it's a good idea to check out Head and Shoulders.
◆ How to use the head and shoulder pattern in cryptocurrencies
The best thing about the head and shoulder pattern is that it can be used for any market. In other words, cryptocurrencies are highly volatile, requiring well-defined tools to help you read the market and filter out the noise. The head-and-shoulder pattern can be reasonably used when trading cryptocurrencies.
You should wait for a head-and-shoulder pattern to form before entering the market. If the pattern is still forming, don't open a position expecting a break through the neckline. The market can change direction in the blink of an eye and you may be opening a position in the wrong direction.
Instead, the first thing you should do is be patient and monitor the market. You need to plan your trades ahead of time and be prepared to take action when the price crosses the neckline.
Stop changes and other factors that make you consider your target price should also be checked. For example, you should start by looking at the previous support line, which could be the target price for a sell order.
Conservative traders can be patient and wait for the price to cross or approach the neckline, even if the neckline is sometimes broken. However, you risk missing out on trading opportunities while waiting for a reversal. Therefore, a general recommendation is to open a position immediately after the close of a candle below its neckline. However, you should also be aware that there are false breakthroughs.
The most interesting thing about this pattern is that you can easily set up take profit and stop loss orders. To manage risk, set your stop loss slightly above the peak, which is the head of the pattern. For the inverse pattern, the stop loss should be placed just below the lower low. How to calculate the take-profit target price has already been described in details.
◆ Head and Shoulder Pattern Advantages
Here are some reasons why you should keep an eye on the Head and Shoulders pattern.
This time-tested chart pattern provides the strongest reversal signal. Traders consider it one of the most reliable technical analysis patterns.
The head and shoulder chart pattern can be used with all markets, including cryptocurrencies, and trading assets.
It is relatively easy to identify a chart after you understand its elements and practice a few times.
This pattern has well-defined risk and return criteria, making it suitable even for beginners.
◆ Head and Shoulder Pattern Limitations
Head and Shoulders is considered a reliable pattern, but it is not perfect. In fact, the market is unpredictable, so there is no ideal pattern. Some of the downsides to consider are:
1. Beginners may find it difficult to identify this pattern on a chart.
2. Lowering the price may allow the neckline to be retested, which can be confusing for novice traders.
3. You have to wait for the whole pattern to complete, which can take a long time especially for swing traders.
4. The pattern cannot guarantee profit. Occasionally a stop loss may run, but this is true of any chart pattern.
출처-바이비트 런 (바로가기)
|
2021년 해외코인거래소 순위 및 추천 |
|||
|
|
|
|
|
|
거래량 |
11조(1위) |
3.5조 |
9.5조 |
|
레버리지 |
최대100배 |
최대100배 |
최대125배 |
|
수수료 |
- 지정가 : 0.02% - 시장가 : 0.04%(1위) |
- 지정가 : -0.025% - 시장가 : 0.075% |
- 지정가 : -0.025% - 시장가 : 0.075% |
|
거래방법 |
현물+선물+마진 |
선물+주식+FOREX |
선물 |
|
회원가입
|
|||
|
할인코드
|
|||


