

4. How to set up an upbit chart

This is how to set the UPbit sub-indicator. It is designed to use various sub-indices, but I use 3 moving averages, Bollinger Bands, and RSI as the basics.
auxiliary indicator
- moving average
- Bollinger Bands
- RSI
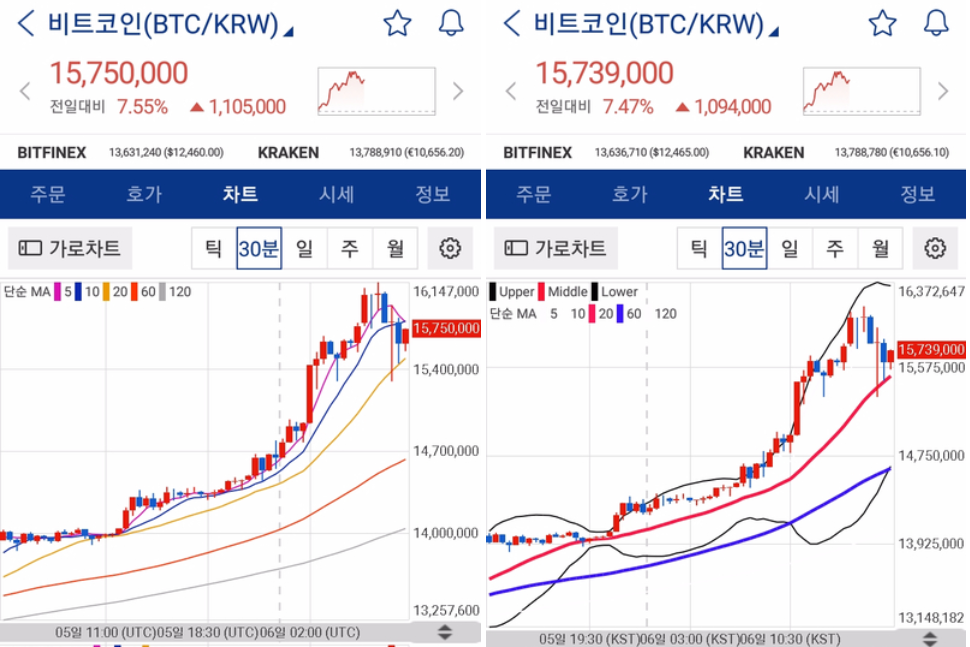
The left side of the image above is the chart shown when no settings are made, and the right side is the finished version.
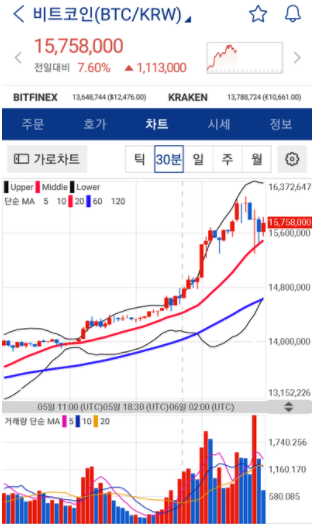
Then we start with setting the moving average, which is the basis of trading.
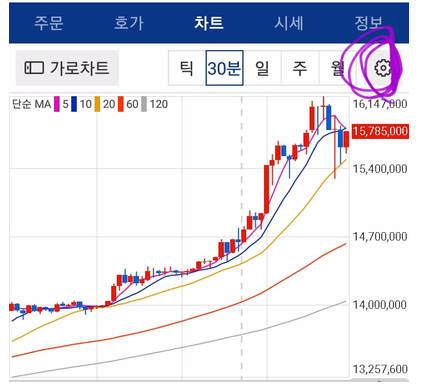
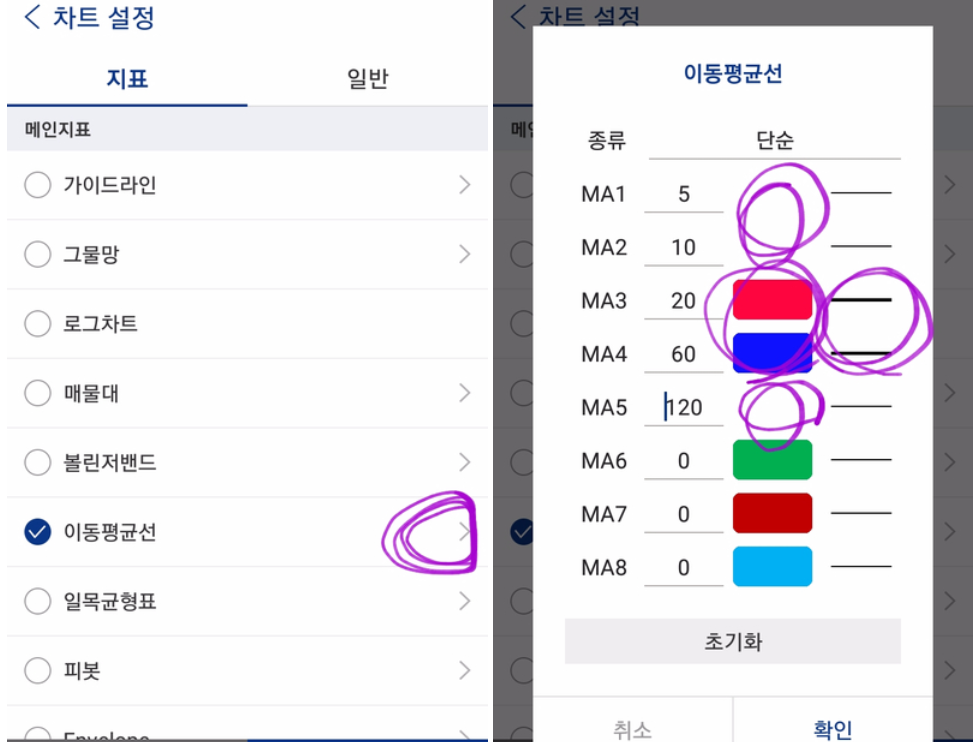
Click the gear wheel in the upper right corner of the chart to set various indicators. Click 'Moving Average' here to set the 20 moving average and the 60 moving average. Since I only use these two moving averages, change the rest to white, and the 20 moving average to be red, The 60 moving average is colored blue.
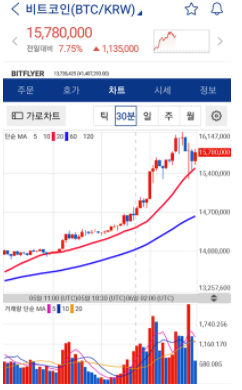
When the setting is completed, it will appear as above. The basis of buying is the chart > 20 moving average > 60 moving average, which is the most basic buying picture.
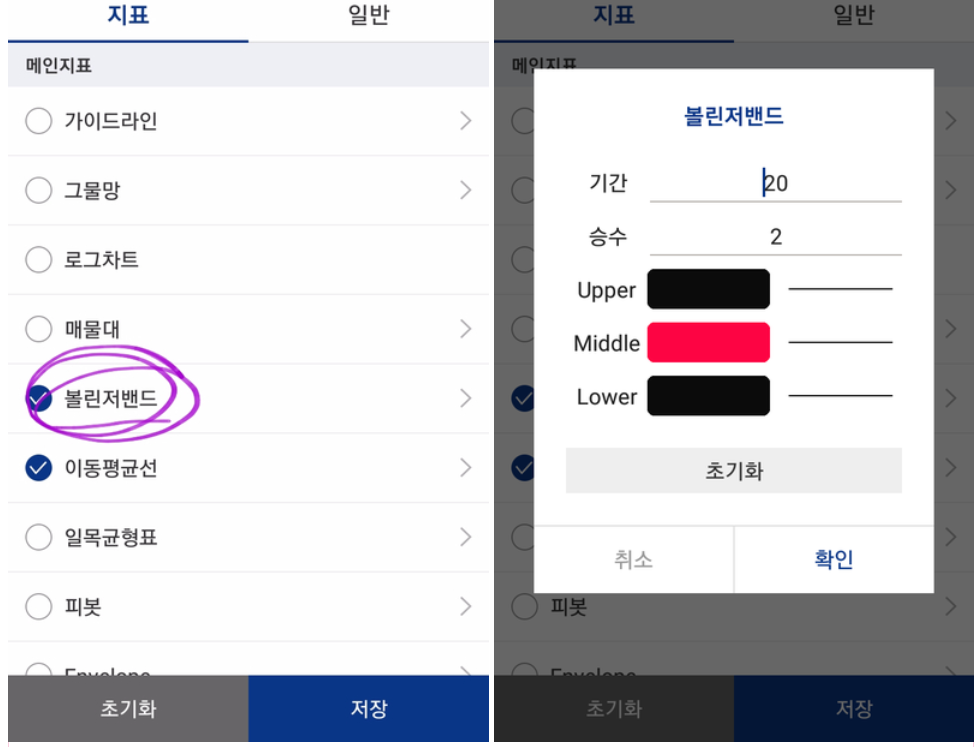
Here is the Bollinger Bands setup.
Bollinger bands are used to predict the overall chart flow, and use indicators based on the characteristics that lie between 95% of the bar chart's Bollinger bands.
When you click Bollinger Bands, period:20, multiplier:2 are entered, and you can use it as is.
Then, not the red and blue moving averages, but black bands. Looking at the chart above, most of the charts are inside the Bollinger Bands, right?
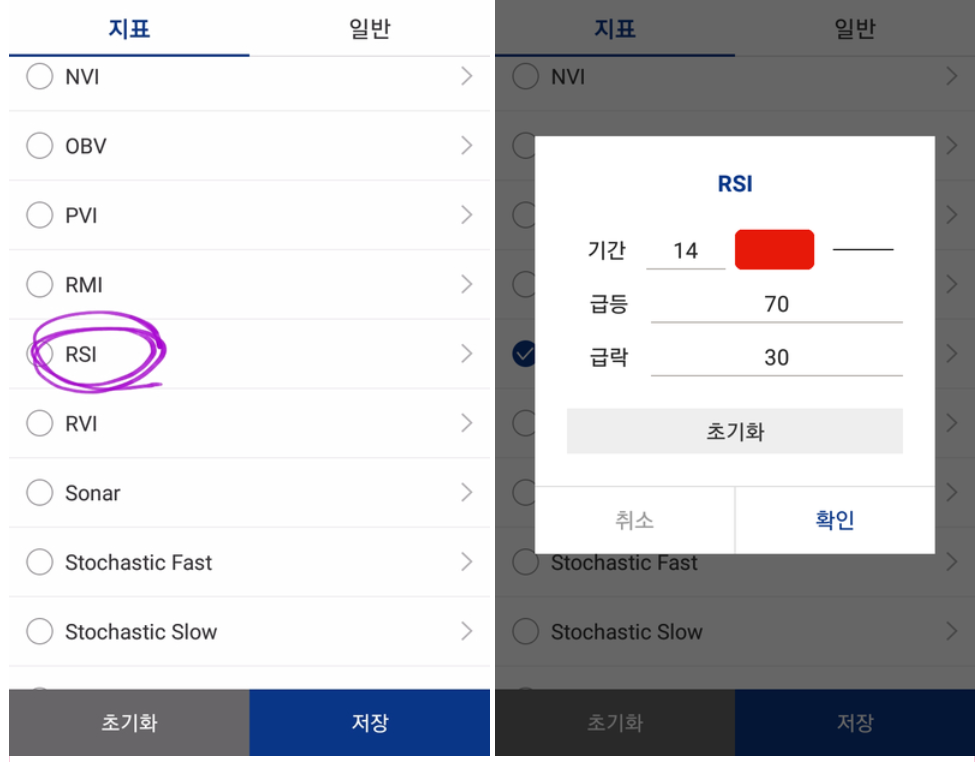
Here are the RSI indicators:
This is an indicator of overbought and oversold sections. If it is an overbought section, it is interpreted as a state in which it will not be strange when the price falls. An upward forecast is possible.
RSI indicators above 70 are set as overbought and below 30 as oversold.
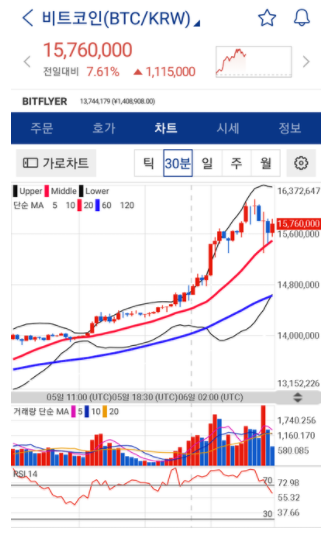
Then, if you set all three sub-indicators, you will have an upbeat chart like the one above.
|
2021년 해외코인거래소 순위 및 추천 |
|||
|
|
|
|
|
|
거래량 |
11조(1위) |
3.5조 |
9.5조 |
|
레버리지 |
최대100배 |
최대100배 |
최대125배 |
|
수수료 |
- 지정가 : 0.02% - 시장가 : 0.04%(1위) |
- 지정가 : -0.025% - 시장가 : 0.075% |
- 지정가 : -0.025% - 시장가 : 0.075% |
|
거래방법 |
현물+선물+마진 |
선물+주식+FOREX |
선물 |
|
회원가입
|
|||
|
할인코드
|
|||


