

7. How to view Bitcoin Trading Volume
Volume(거래량)은 시간이 흐르면서 특정 자산의 주인이 변화하는 것을 보여주는 수치 입니다.
What is Trading Volume?
- The trading volume shows the number of shares of a specific asset class being traded within a specific time period.
- In the stock market, it is usually calculated in units.
- Volume measures the relative importance of market movements.
- In the course of price fluctuations, if the trading volume increases, the reliability is higher than when the trading volume is low.
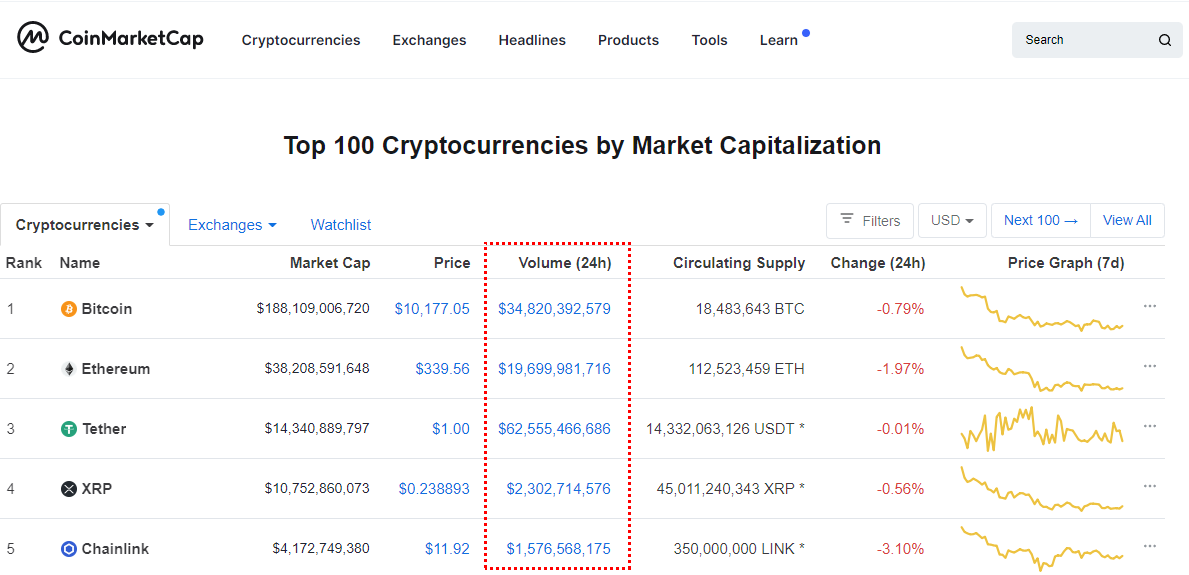
CoinMarketCap Trading Volume by Coin
【Essential explanation of Trading Volume】
We hear trading volume is important everyday over and over again. But if you don't understand the nature of trading volume, it's hard to make full use of it. So, in this post, we will focus on the essence of trading volume.
1. Each time a buyer and a seller conclude a trade, the number of trades is accumulated from the total trade volume. A trade is concluded when a certain price agreed upon by the buyer and seller is reached.
2. It shows trading volume free of charge for asset classes that normally have liquidity, such as securities/bonds/coins. Investors can access data in units of units/weeks/months/years and even ticks.
3. Volume informs investors of market activity and liquidity. Higher volume means more liquidity and more active trading between buyers and sellers.
CoinMarketCap Bitcoin Price & Volume
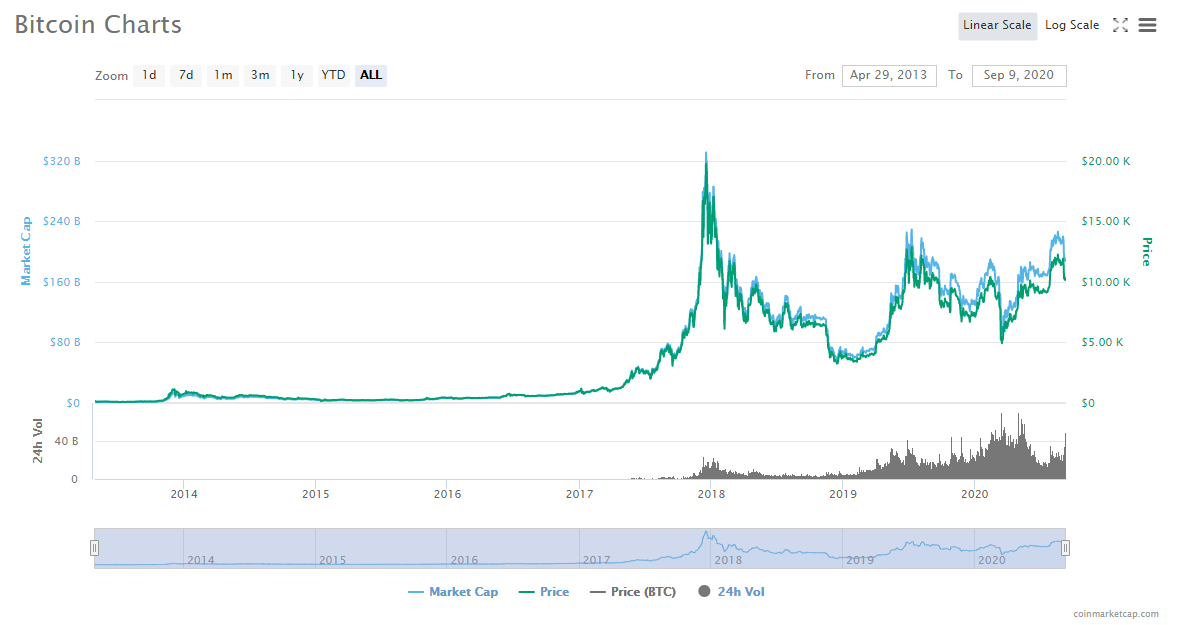
CoinMarketCap Bitcoin Price & Volume
【Transaction volume approached by technical analysis】
1. Investors/traders who invest in technical analysis usually consider what/when/how much they will enter and exit. Volume can be some kind of proof that the tie is optimal for them.
2. Volume is a measure of relative importance in the market. If the price fluctuates as the market surges in volume within a certain amount of time, this will give you more confidence. If the volume increases while rising, buyers outnumber sellers. And you can recognize it as a process of changing hands.
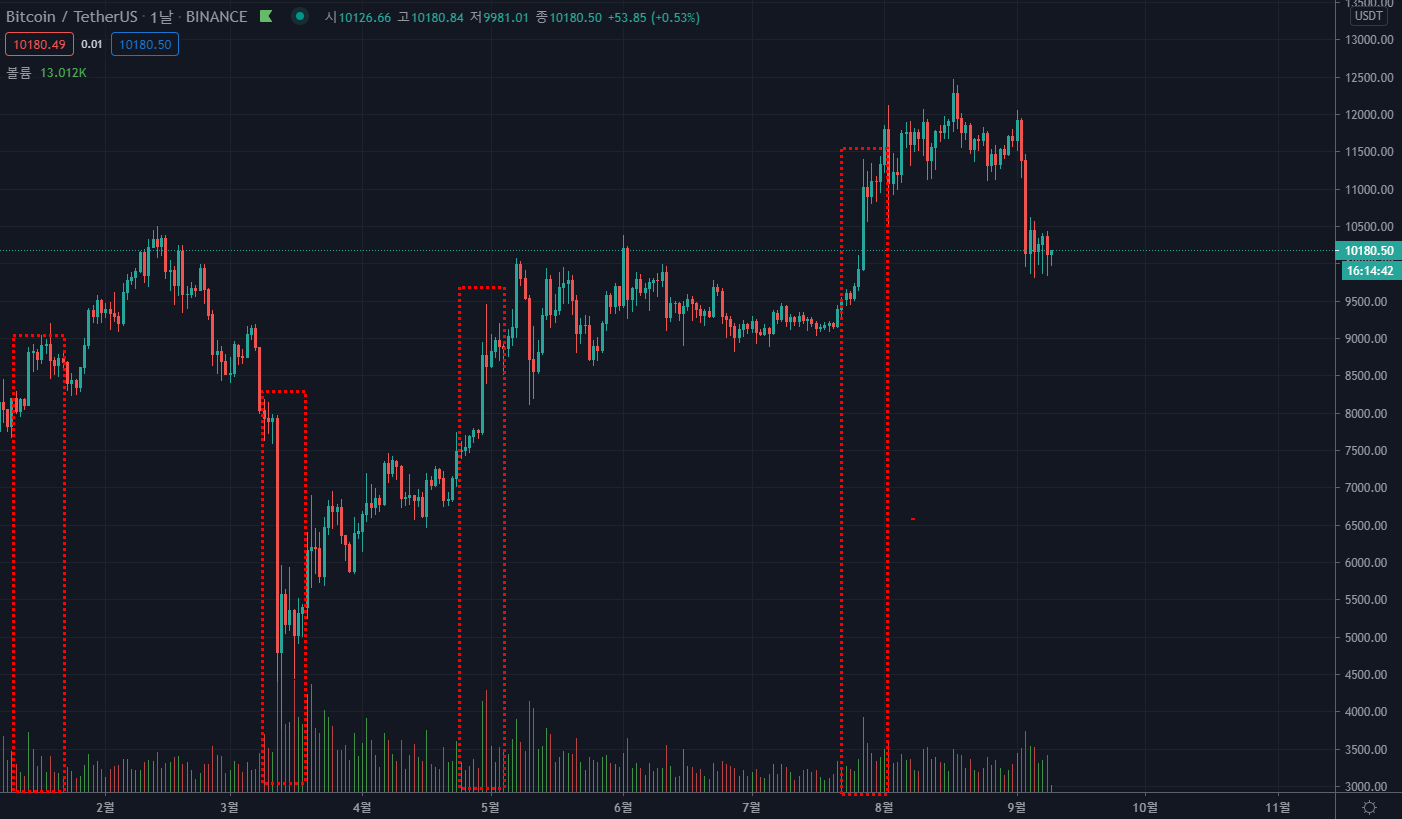
3. Many market participants usually use a bar chart to determine their trading volume. It can be used as a kind of signal if it shows an above-average trading volume within a specific period (eg daily/weekly/monthly, etc.).
4. Those who trade in a reverse trend may think of it as an entry section if the volume rebounds sharply from the support level after the price declines. Conversely, trend-followers can use this as evidence that the trend has changed if the price is temporarily down after a surge and the volume is higher than usual. On the other hand, if the volume is low in both cases, it may be a FAKE signal.
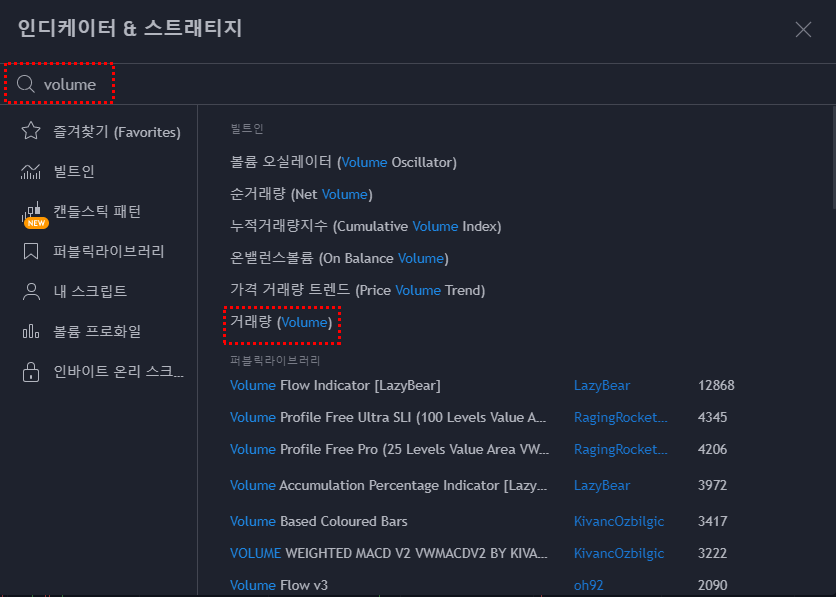
Example of Trading View
【How the market refers to the trading volume】
While we were doing algorithmic trading, we decided which coin to trade on which exchange in a top-down method.
1. Find out which exchanges have the highest trading volume.
- As a result of examining the trading volume rankings of exchanges, Binance has the most active trading volume.
2. We have confirmed which coins have the highest trading volume.
- When it comes to algorithmic trading, it is very important to have an abundance of trading volume.
- When there is sufficient mobility, slippage (the cost incurred when a transaction cannot be concluded at the desired asking price) can be minimized.
- The difference is small, but the result is very different when it is accumulated. As a result, we were able to confirm that the performance of the trading bot differs for each exchange.
- As Bitcoin and Ethereum occupy 70% of the total market, liquidity is also abundant.
3. I visually checked the liquidity by observing the order book of Bitcoin and Ethereum on Binance's SPOT (spot) exchange for several hours without thinking.
- It will vary by section, but with this level of liquidity, it was subjectively judged that even if it was concluded for about 1 billion won, there would be no significant problems.
- The strategy originally used can minimize slippage through time frame distribution, but it seemed that there was no difficulty in rolling the currently operated funds.
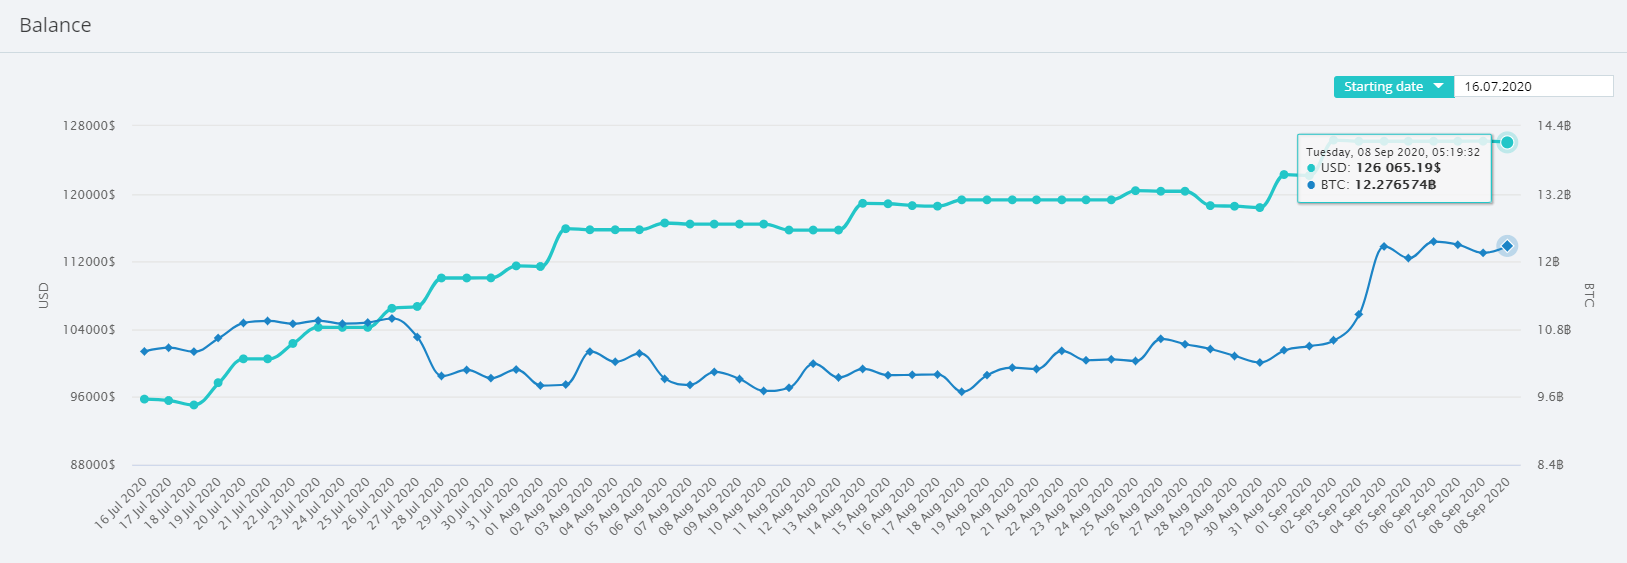
실제 자금 운용 성과 예시
|
2021년 해외코인거래소 순위 및 추천 |
|||
|
|
|
|
|
|
거래량 |
11조(1위) |
3.5조 |
9.5조 |
|
레버리지 |
최대100배 |
최대100배 |
최대125배 |
|
수수료 |
- 지정가 : 0.02% - 시장가 : 0.04%(1위) |
- 지정가 : -0.025% - 시장가 : 0.075% |
- 지정가 : -0.025% - 시장가 : 0.075% |
|
거래방법 |
현물+선물+마진 |
선물+주식+FOREX |
선물 |
|
회원가입
|
|||
|
할인코드
|
|||


