

7. How to trade Bollinger Bands
Here are 7 practical trading methods using Bollinger Bands.
The Bollinger Bands Trading Act deals mainly with the following two points.
1. It is recommended to pay close attention to the contraction and expansion of the band.
2. It is important to look closely at the direction of the center line.
For instructions on how to watch Bollinger Bands, click here!
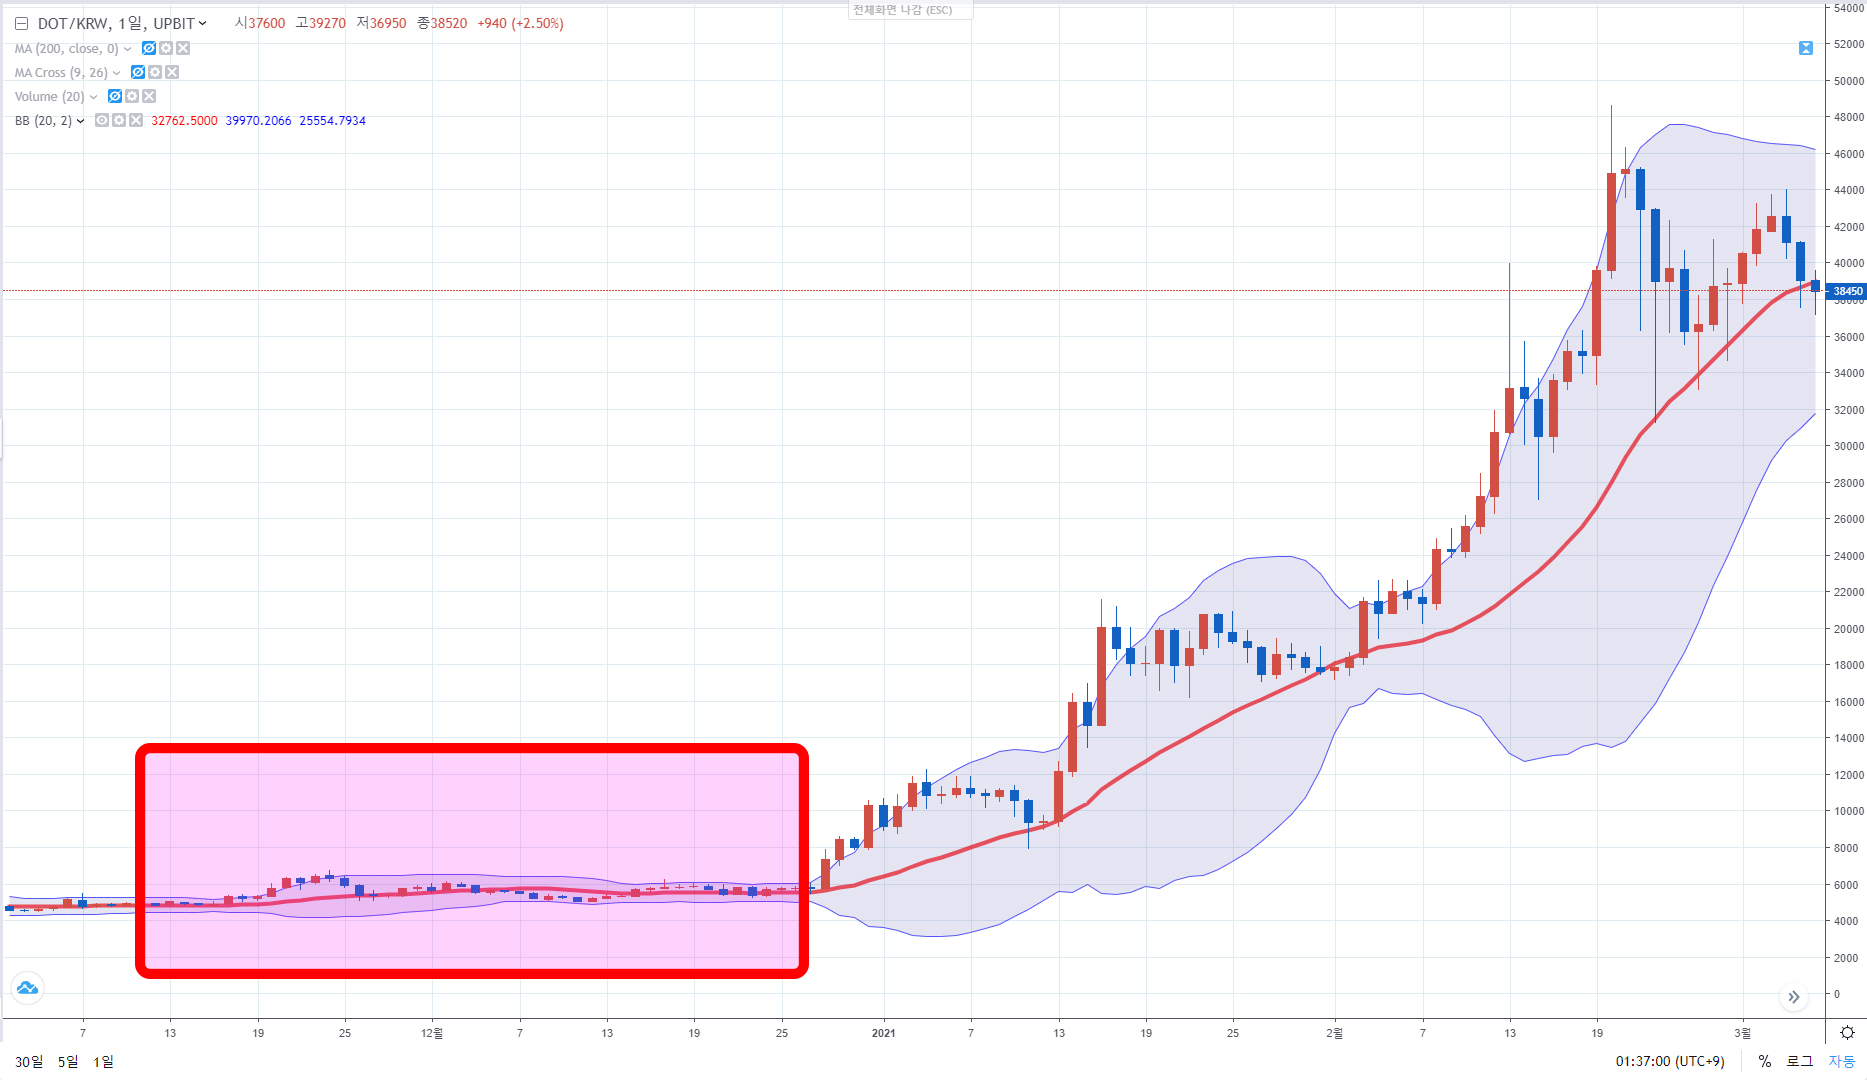
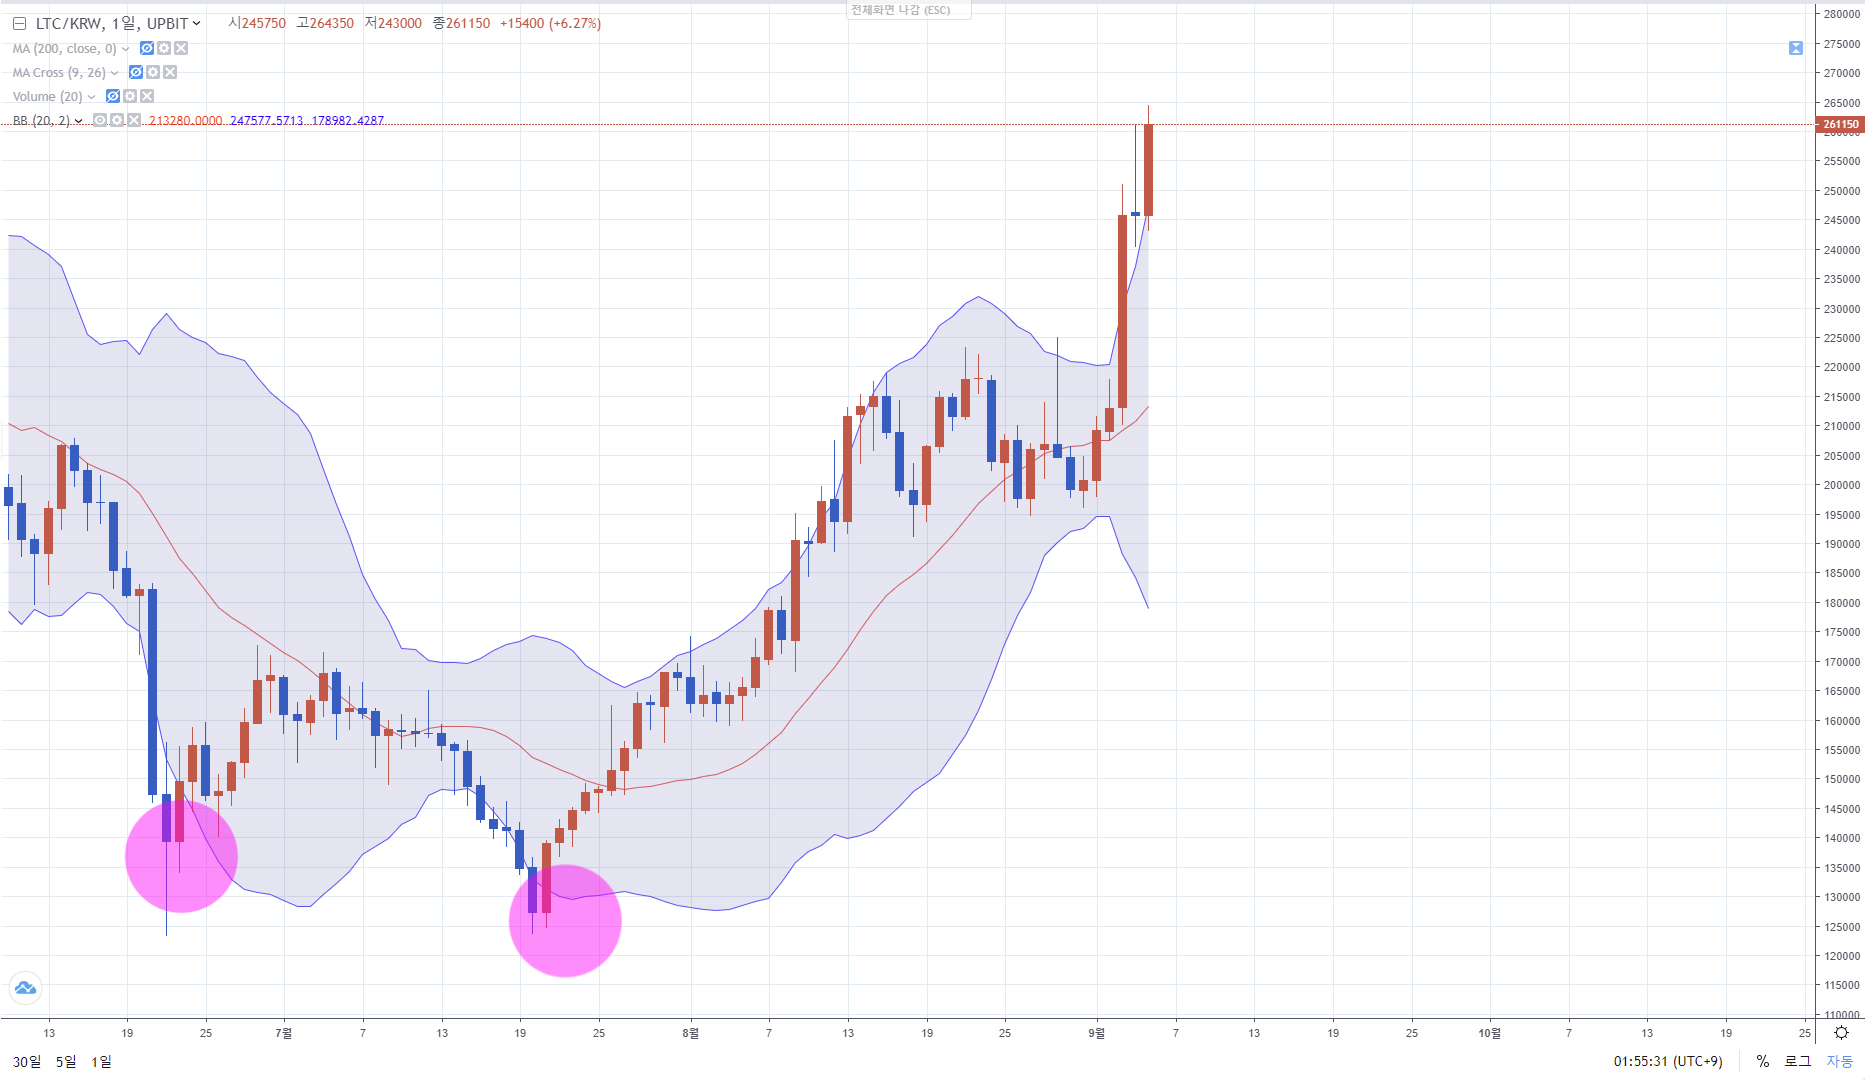
◆ Upward transition after narrow bandwidth
The stock price movement that occurs after the stock price movement decreases and the width of the band tightens is sharp. It can be seen as a process of folding into an upward phase.
In the process of expanding the bandwidth, the stock price shows an attempt to break out of the upper limit, which can be seen as an upward expansion phase.
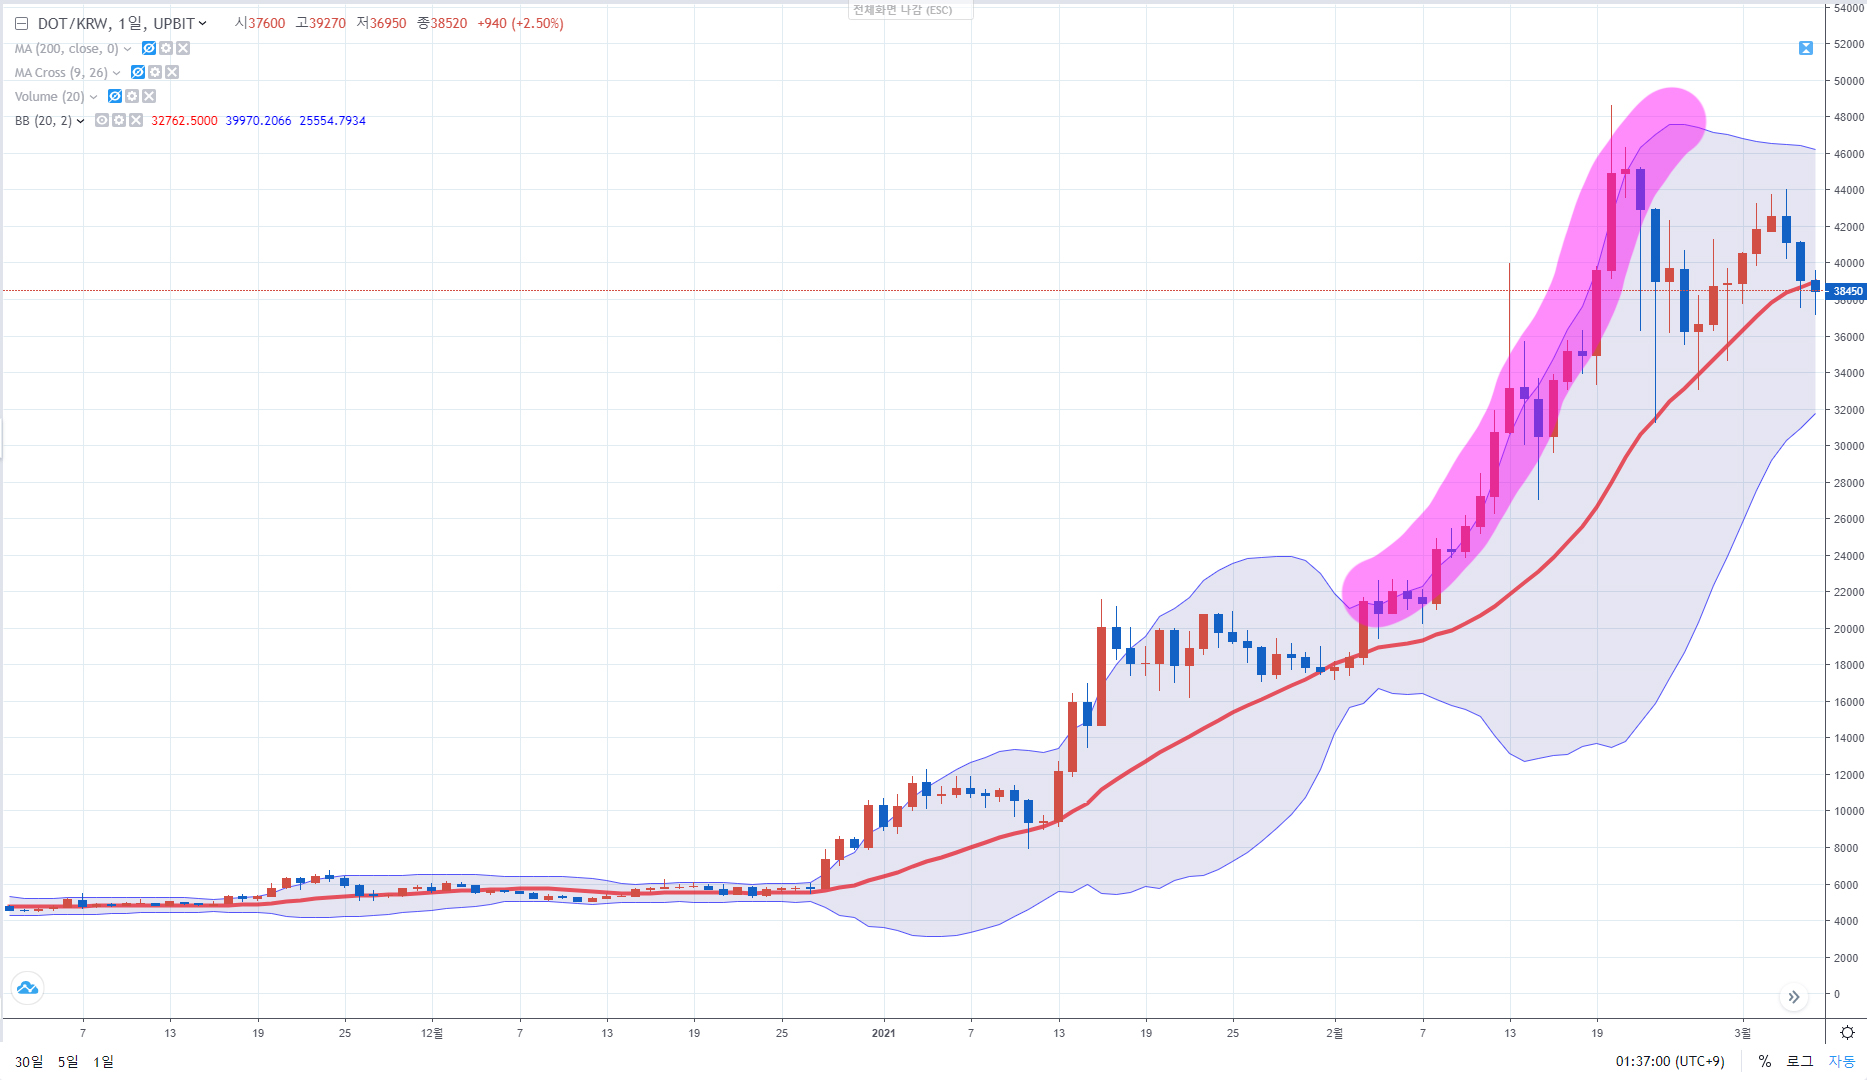
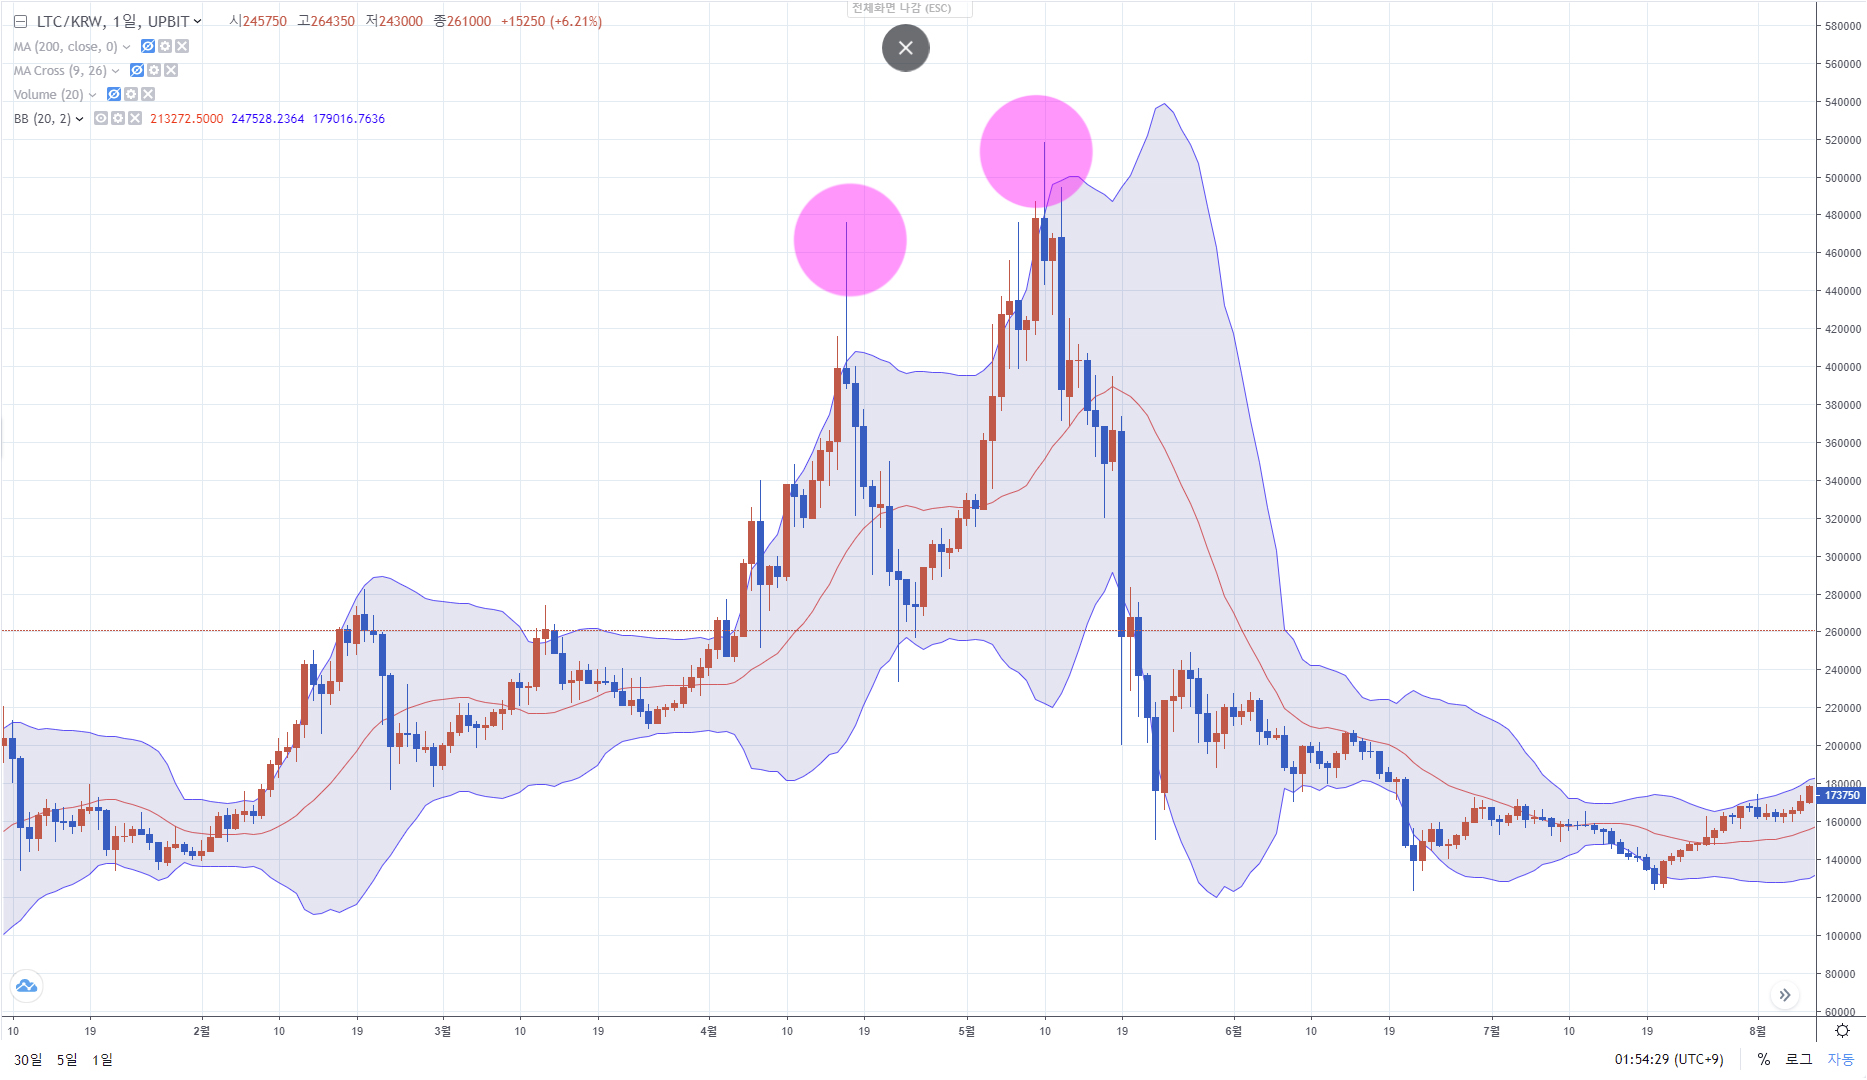
◆ Walking the Band by John Bollinger
In the medium term, when a trend is formed, it crosses the upper Bollinger band and rises very strongly. This can be seen as the formation of a strong upward trend. If you use the strategy of holding until the trend is broken, you can expect to realize big profits.
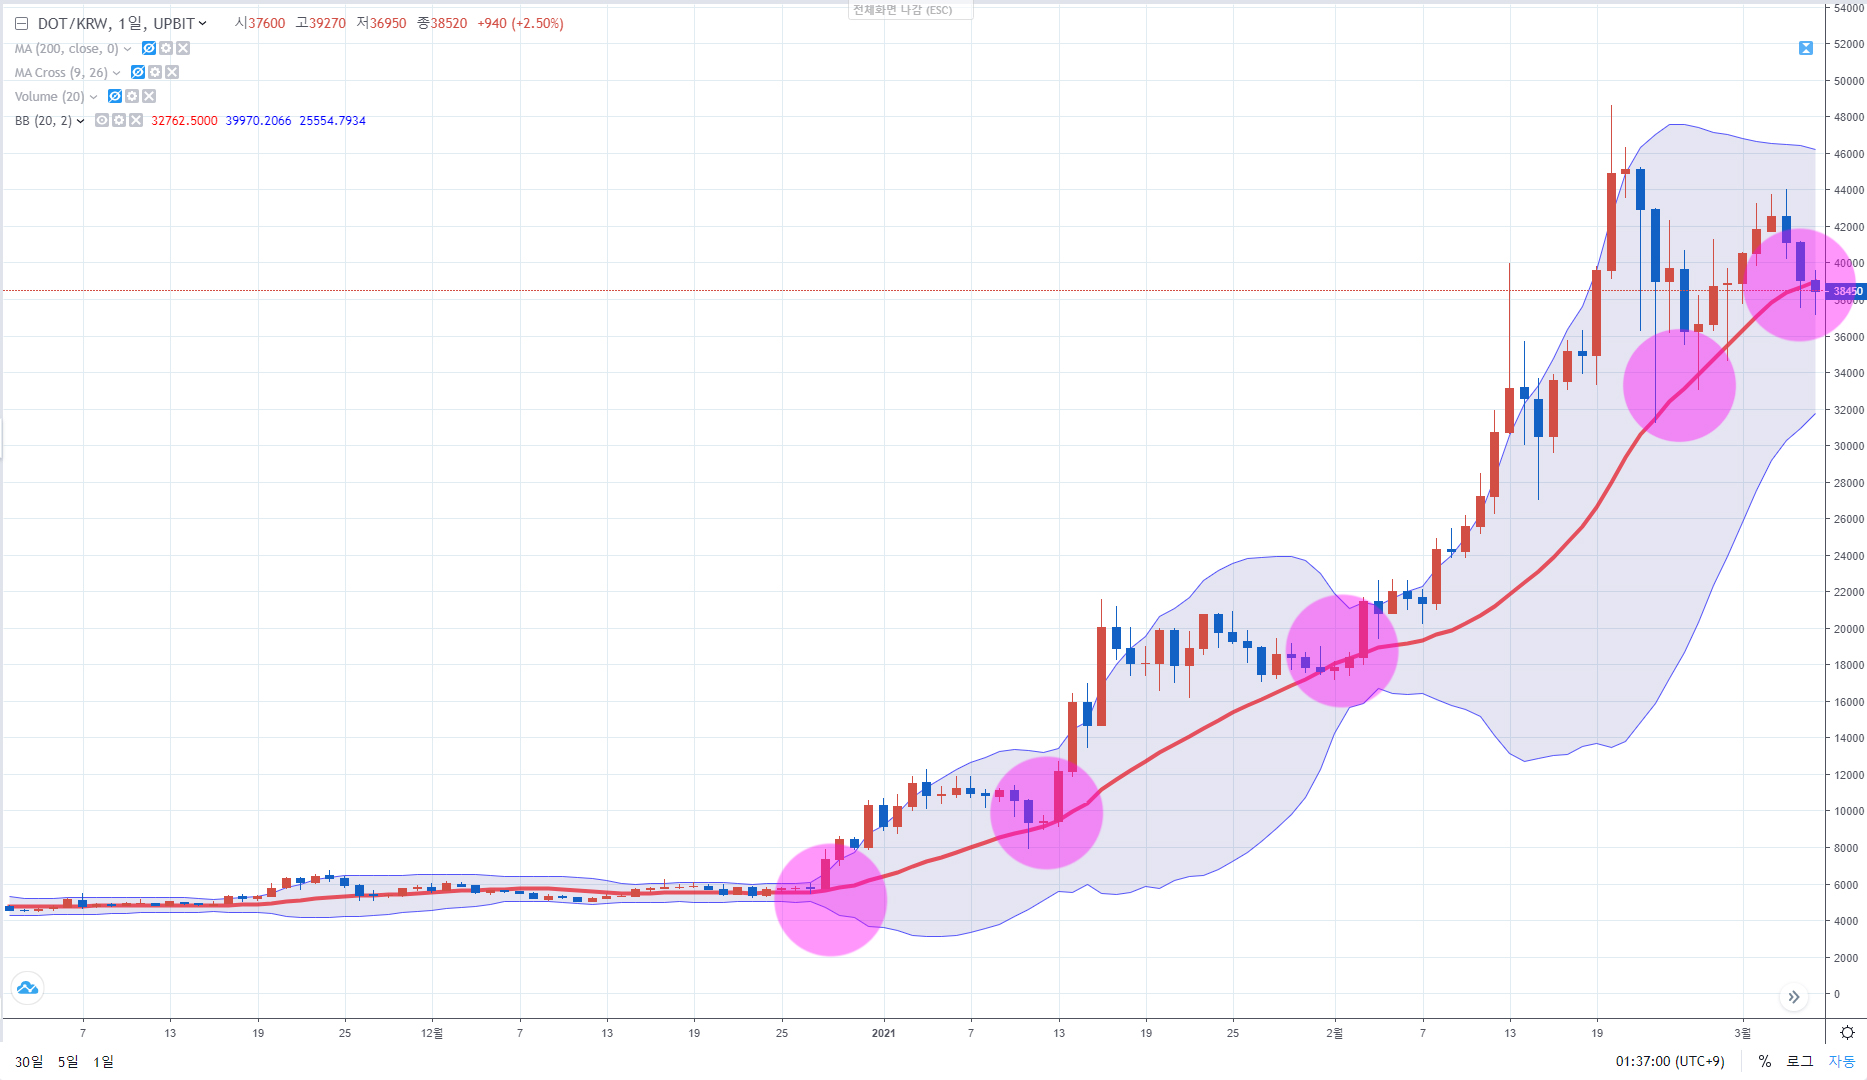
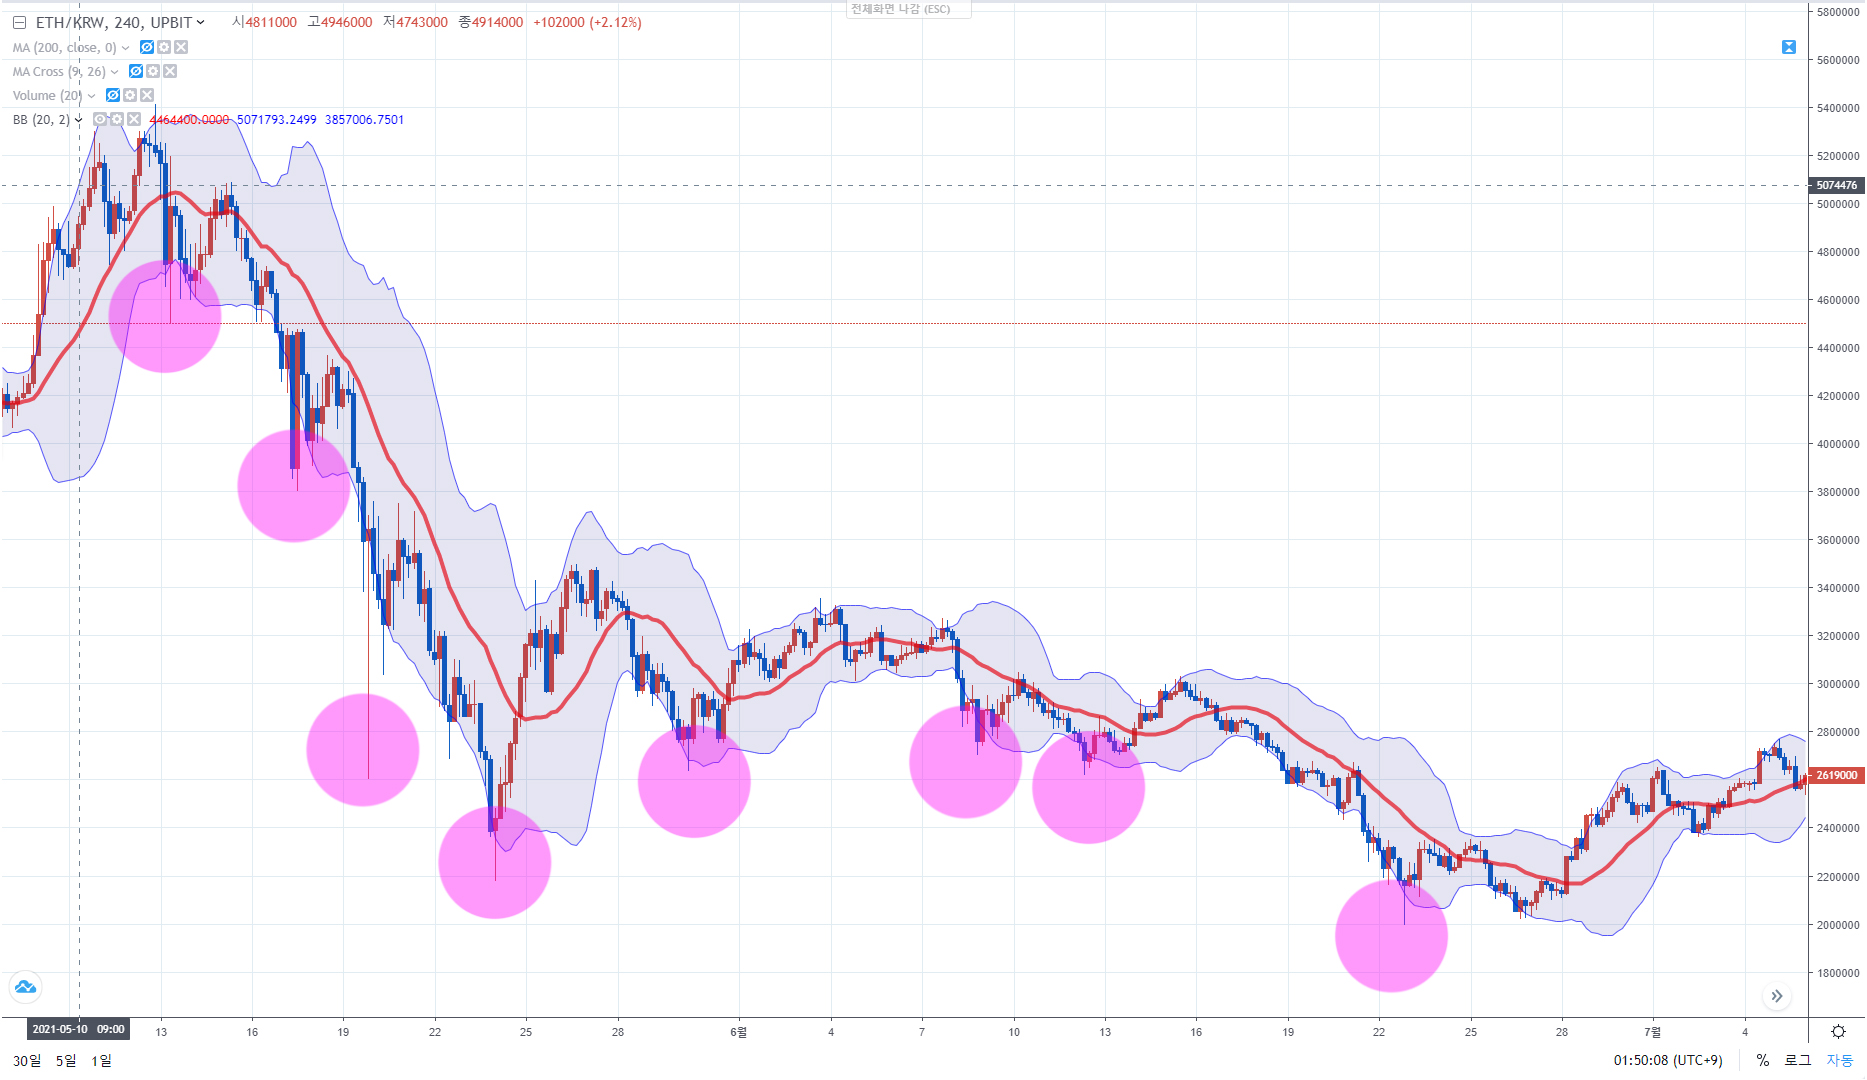
◆ When the midline acts as a support line
When an uptrend is formed, the midline acts as a support line. If the uptrend continues, you can buy at the midline (20-day moving average) and continue holding as long as the midline is not broken. If the trend is broken after the midline is broken later, taking a profit-taking strategy is a good use of Bollinger Bands.
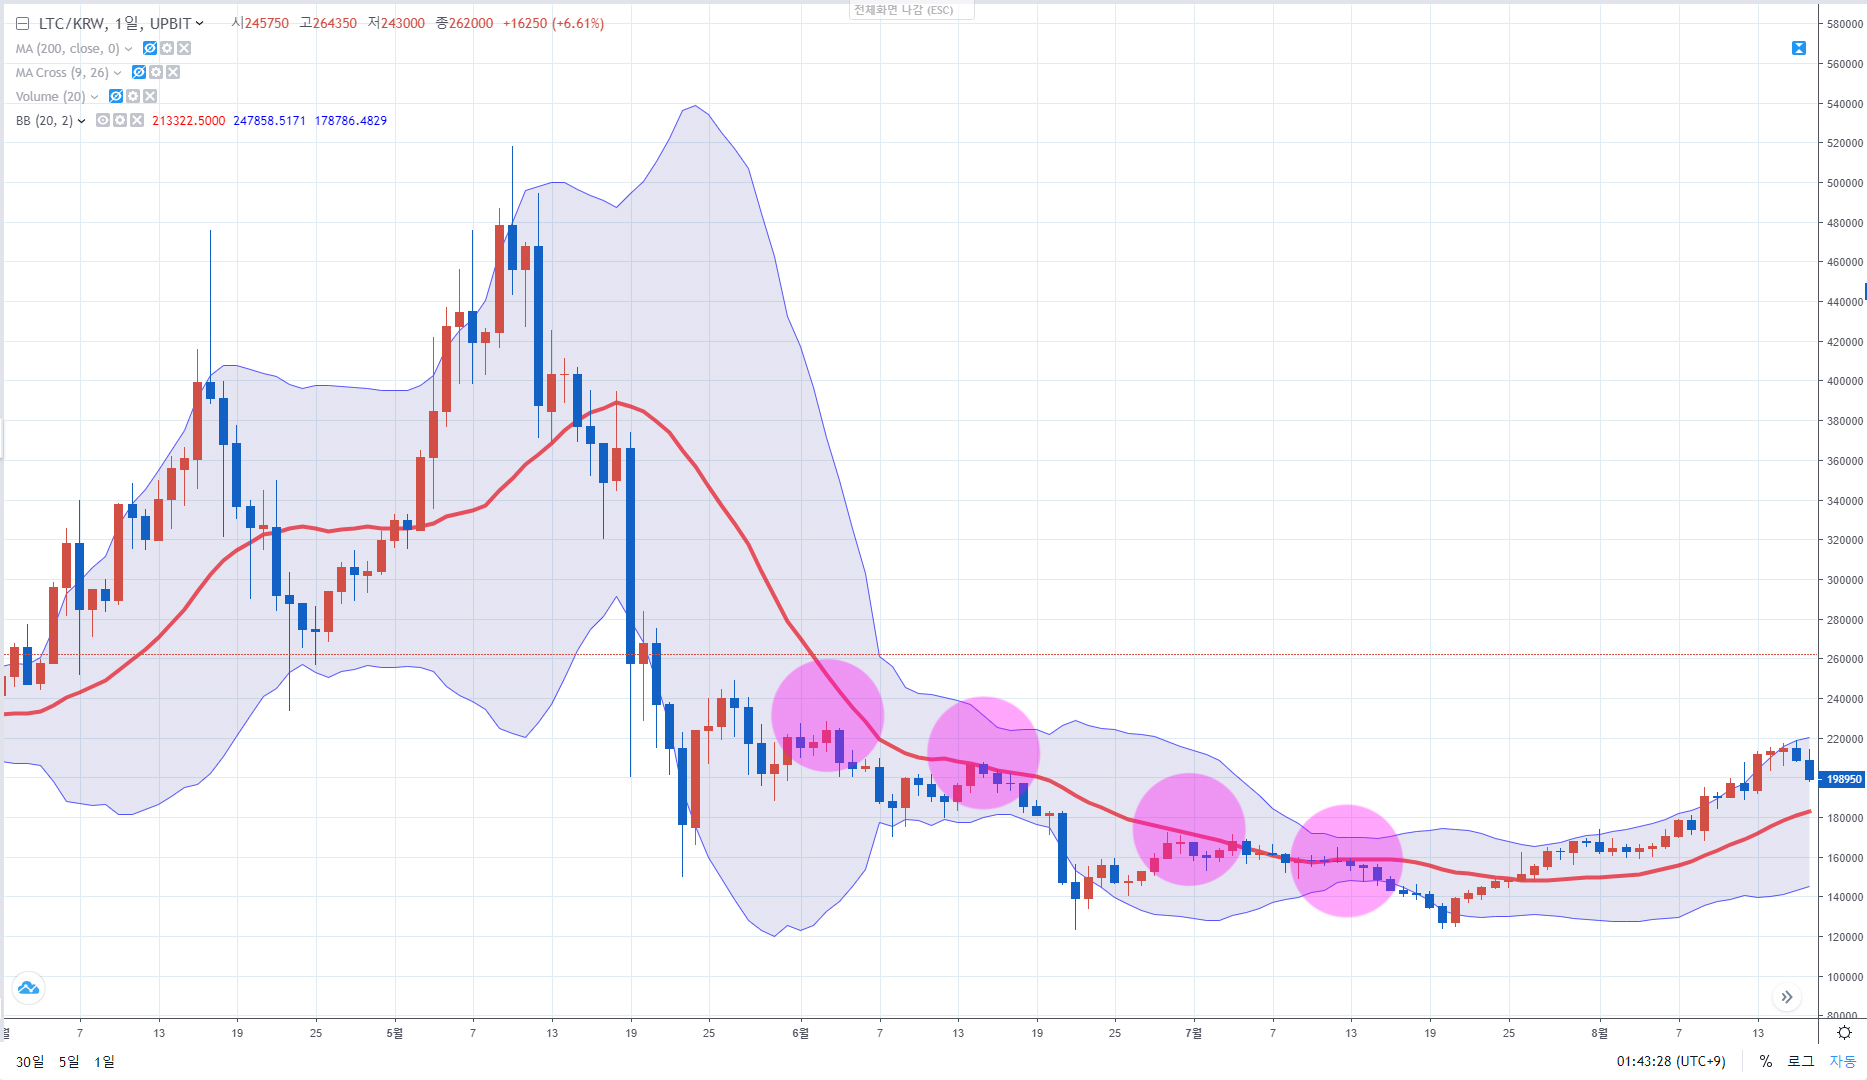
◆ When the midline acts as a resistance line
Let's look at the role of the midline in a downtrend. In a sustained decline, the midline acts as a resistance line. Other than taking a short position in a downtrend, buying is not a good way to trade.
◆ If the stock price falls below the lower band
This is the case for short-term trading. If the stock price falls below the lower band during the day, it can be viewed as a long position in the short term. When the stock price outside the band shows a bullish trend, it is recognized as a short-term trend reversal signal when it enters the band.
◆ Change the sound bar after leaving the upper band
When it breaks out of the uptrend and then comes back into the band with a negative sign, it is recommended to recognize it as a short-term selling point and sell. This suggests a short-term trend reversal. At this time, it is recommended to take a short position and then buy again depending on whether the midline is supported or not.
◆ Beekeeping conversion after leaving the lower band
The stock price, moving down the lower bound, is turning into a beekeeper, breaking out of the band and then re-entering it. It can be viewed as a short-term buying perspective, and it is recommended to establish a trading strategy by checking whether the midline is broken.
|
2021년 해외코인거래소 순위 및 추천 |
|||
|
|
|
|
|
|
거래량 |
11조(1위) |
3.5조 |
9.5조 |
|
레버리지 |
최대100배 |
최대100배 |
최대125배 |
|
수수료 |
- 지정가 : 0.02% - 시장가 : 0.04%(1위) |
- 지정가 : -0.025% - 시장가 : 0.075% |
- 지정가 : -0.025% - 시장가 : 0.075% |
|
거래방법 |
현물+선물+마진 |
선물+주식+FOREX |
선물 |
|
회원가입
|
|||
|
할인코드
|
|||


