

5. MACD Trading Method
We have summarized the 3 MACD Actual Trading Acts and additional opinions.
You can carefully observe the movement of the MACD and signal lines, and whether they are located above or below the 0 line!
Click the shortcut to see the MACD chart!

◆ Using MACD to capture the trading period
Basically, it lives when it crosses above the MACD 0 line. Sell when it breaks below the 0 line.
If you bought at the 0 breakout and the macd line continues to have a positive value, it is in an uptrend, so it is better to keep the position.
Since MACD is a trend line, it is better to view it along with the trend line of the stock price. If a downward breakout is expected from the trend line of the stock, it is recommended to find a selling point by referring to the MACD line as well.
If the indicator and the trend line are telling you to sell together, it is good to sell. (MACD is more useful as an auxiliary indicator after trend analysis precedes it.)
*Buy point: When the macd line crosses the 0 line upward (entering an uptrend)
When to sell: When the macd line crosses below the 0 line (entering a downtrend)

◆ Golden cross between MACD and signal lines
When the blue MACD line crosses the red signal line, it is better to view it as a buy signal and take a long position.
The stronger the MACD line penetrates, the more accurate the signal can be, and the golden cross, which usually occurs near or below the 0 line, often accurately indicates the rise of the stock price.
The breakout of the signal line appears a little earlier than the buy signal that crosses the MACD 0 line.
It has the advantage of being able to buy it at a lower price.
Lifetime: when the macd line crosses the signal line upwards
When to sell: when the MACD line breaks below the signal line

Even if it crosses below the signal line, if the share price supports the trend line, it can continue to rise after a short-term decline.
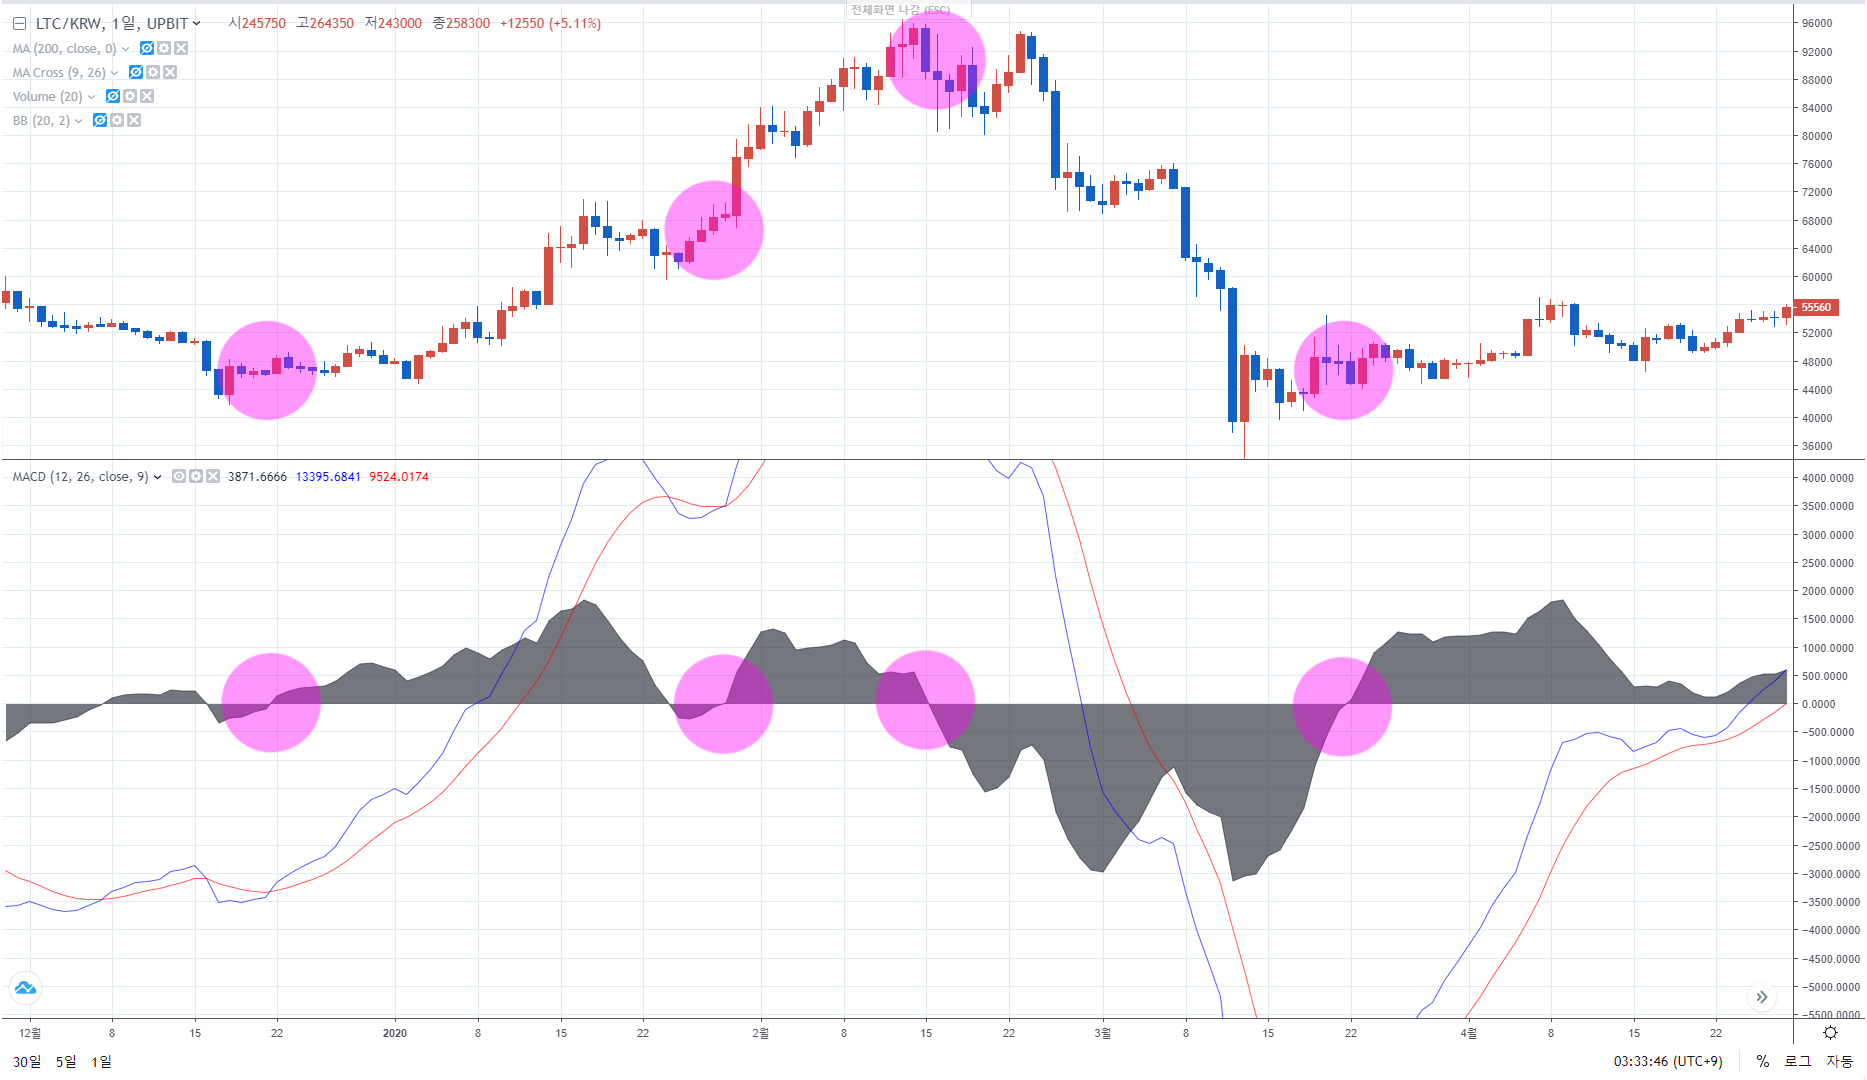
◆ Trading using the oscillator
A trading technique using the timing when the oscillator breaks above the zero line upwards or breaks below the zero line
Buying Point: When the MACD oscillator crosses above the zero line
When to sell: When the MACD oscillator crosses below the zero line.
A support line is drawn at the end of the oscillator bar to predict a trend reversal, but it is useful in a very short-term approach, and caution is needed as there are many false signals.
◆ Advantages/disadvantages of trading using MACD indicators
1. There is little deception when breaking through the 0 line of MSD, but the trailing nature is strong (buy it on the knee and sell it on the shoulder)
2. The MCD signal crossing signal is a fast trading signal, but there are many false signals.
3. The oscillator reversal is a quick trade signal, but there are many false signals.
◆ Additional comments
1. It is not a suitable indicator for a downtrend or a non-trend.
2. Track when an uptrend turns and focus on catching the moment of honest holding and selling.
3. Buy when the signals on the weekly and daily charts are consistently good.
4. Not suitable for coins.
|
2021년 해외코인거래소 순위 및 추천 |
|||
|
|
|
|
|
|
거래량 |
11조(1위) |
3.5조 |
9.5조 |
|
레버리지 |
최대100배 |
최대100배 |
최대125배 |
|
수수료 |
- 지정가 : 0.02% - 시장가 : 0.04%(1위) |
- 지정가 : -0.025% - 시장가 : 0.075% |
- 지정가 : -0.025% - 시장가 : 0.075% |
|
거래방법 |
현물+선물+마진 |
선물+주식+FOREX |
선물 |
|
회원가입
|
|||
|
할인코드
|
|||


