

9. Bitcoin trading volume analysis trading method
In order to do volume analysis, you essentially need to know what volume is.
The essence of trading volume is the trace of the exchange of hands between buyers and sellers. Among market participants, when a specific price is judged to be low, it is bought, and when a specific price is judged to be high, it is sold.
Whether the price is cheap or expensive is determined by different criteria for each investor.
So, what are the benefits of volume analysis?
It is caught in the statistics because the transaction actually occurred, and you can derive various trading ideas by using the trading volume auxiliary indicator in addition to the pure trading volume!
We will share trading ideas with examples through case analysis.
It should be noted that these conditions are met unconditionally. You can look at it from a probabilistic point of view rather than rising or falling. Also, as this has already happened, please be aware that it may be a post-judgment!
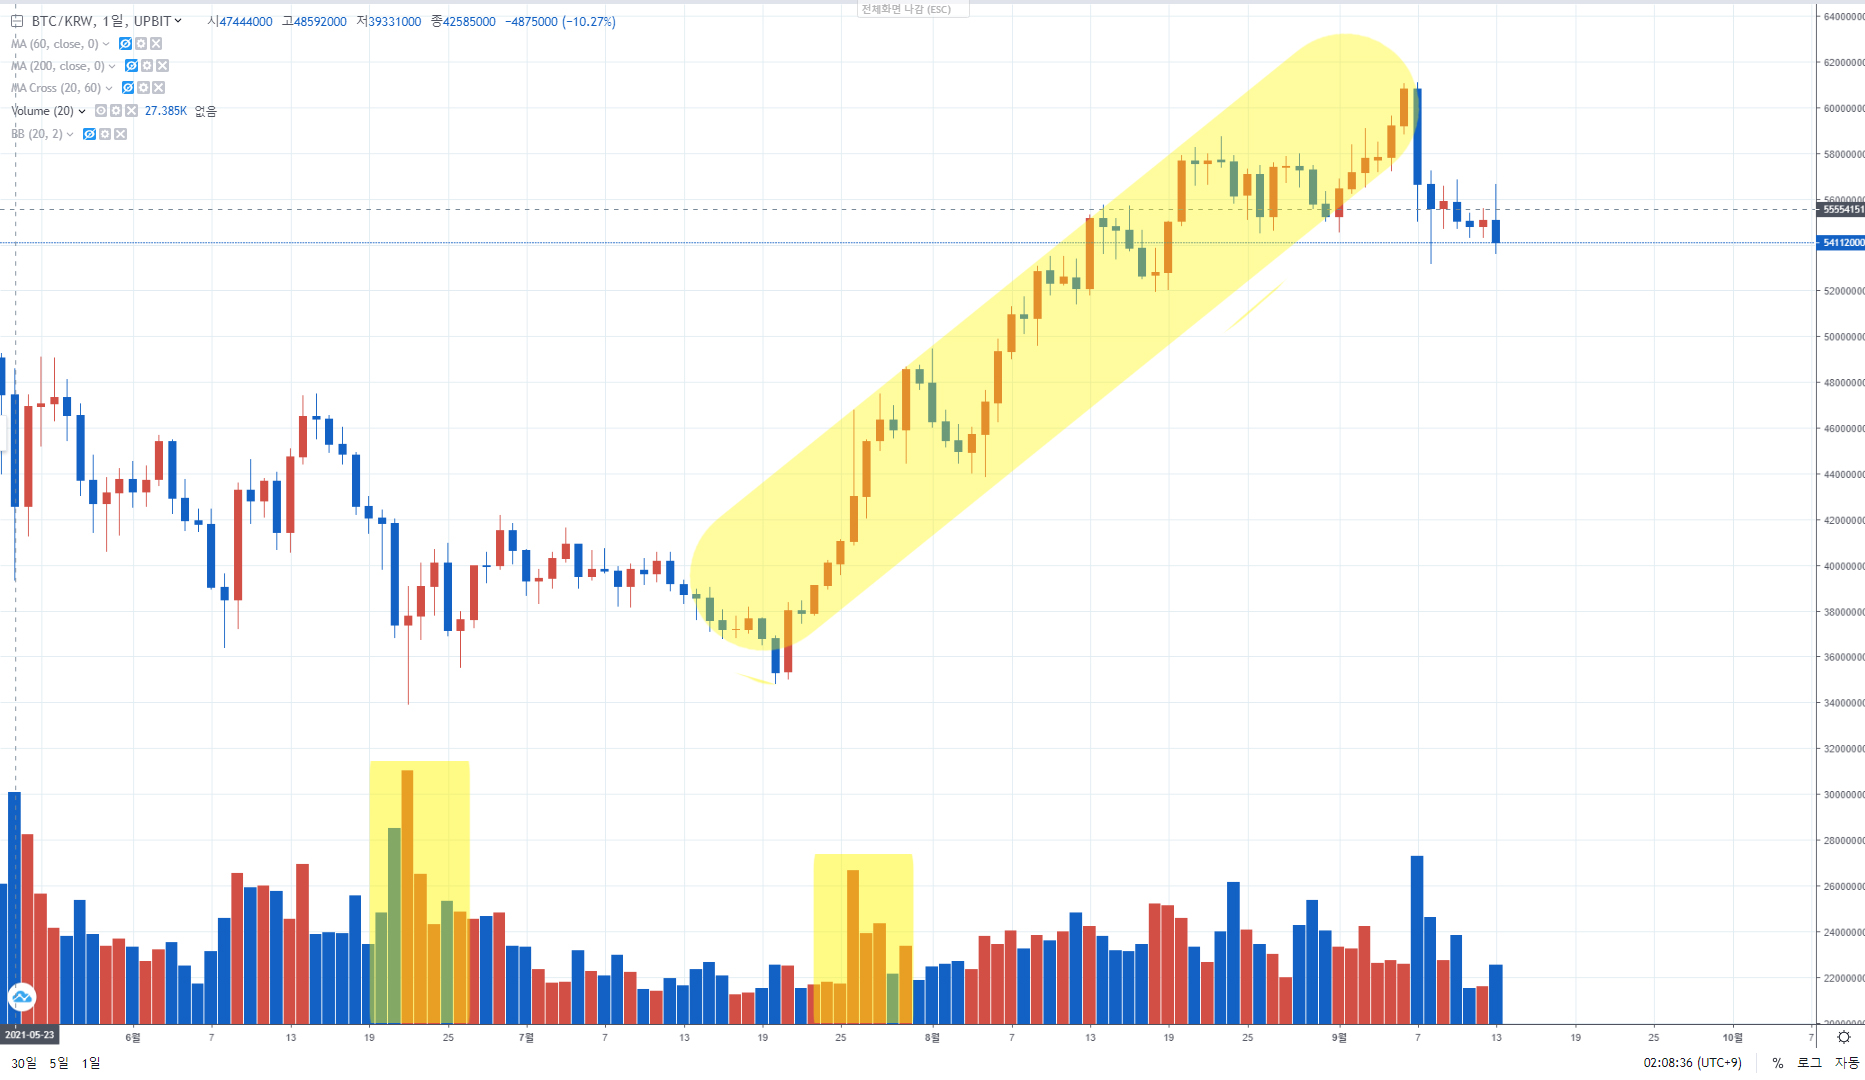
◆ Rise → Increase trading volume → Long beekeeping → Buy
1. An increase in trading volume as the price rises means that the profit-taking property is digested and the trading volume rises.
2. At this time, if the candle closes with a long beekeeper, this can be regarded as a signal for a trend uptrend.
◆ Fall → Volume boost → Long black bar → Sell
1. If the trading volume bursts in a high state and a long black peak appears, it is a signal that the power that has previously made a lot of profits is leaving the market.
2. In this case, a downtrend and correction are likely to begin.
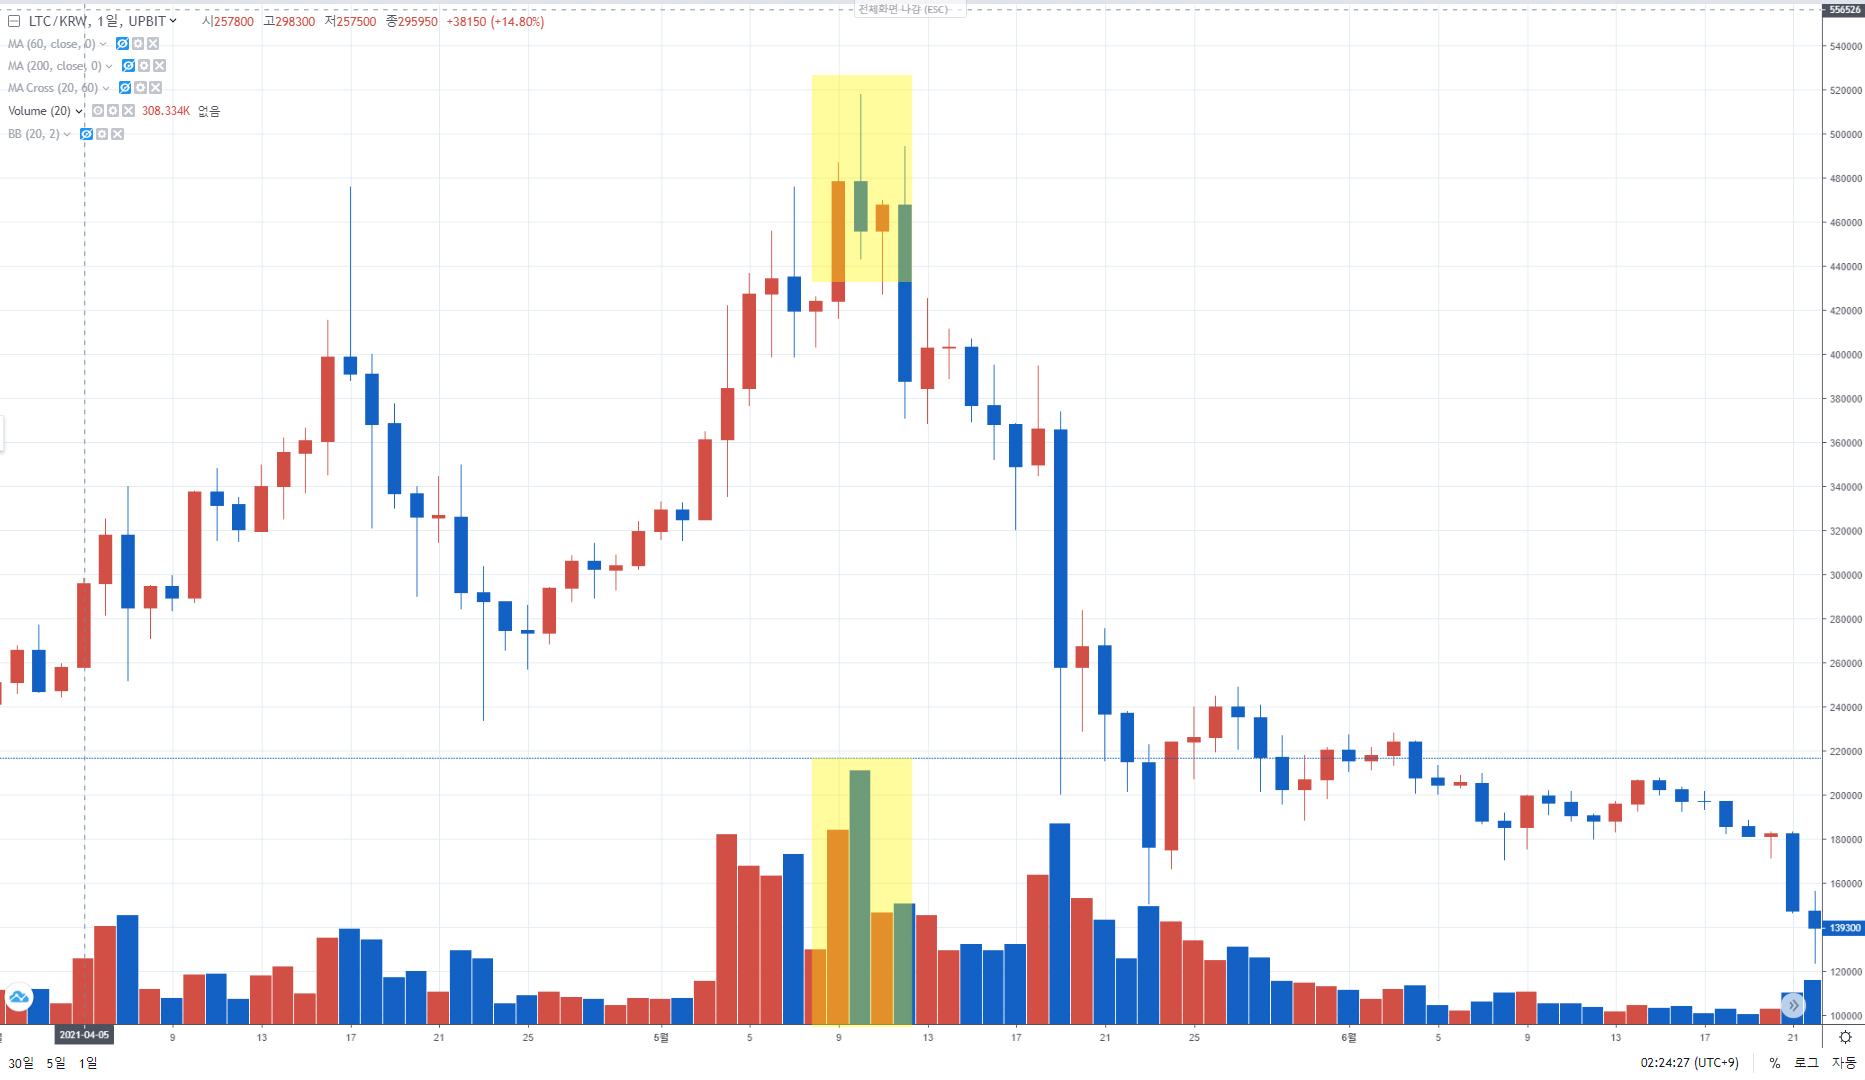
◆ Rise → Increase volume → Long upper tail → Sell
1. If the trading volume increased as it broke through the previous high, but closed with a long upper tail, you can see that there were too many items for sale in the front, so you sold even a little.
2. This can be viewed as a buy-in as it is a sideways upward trend, but when a candle with a long upper tail appears in a downtrend, it can be considered a sell signal.
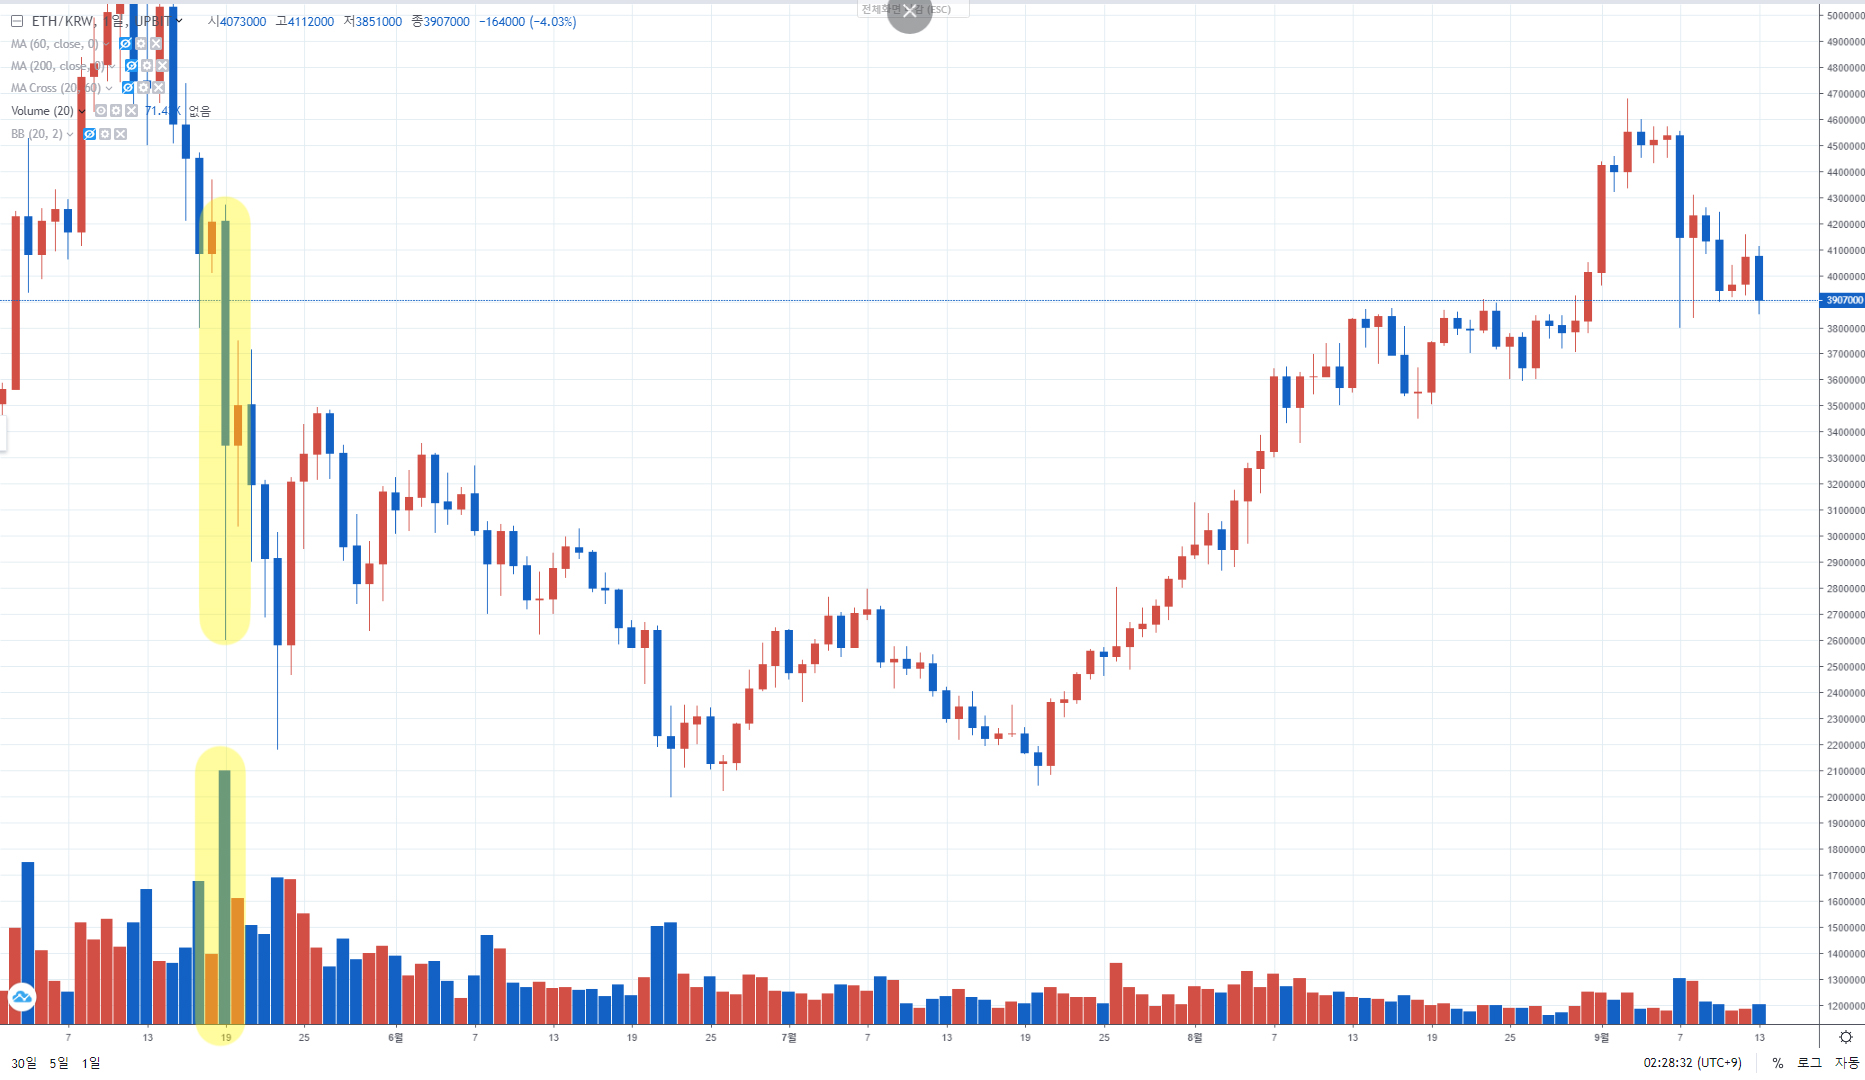
◆ Fall → Volume boost → Long lower tail → Buy
1. Below you can see the huge volume of trading as it recently reached its previous low.
2. Usually, in this case, market participants panic and forcefully throw a stop loss or quantity.
3. And sooner or later, countertrend traders will enter positions and lower tails. If you buy in fear, this is a good opportunity.
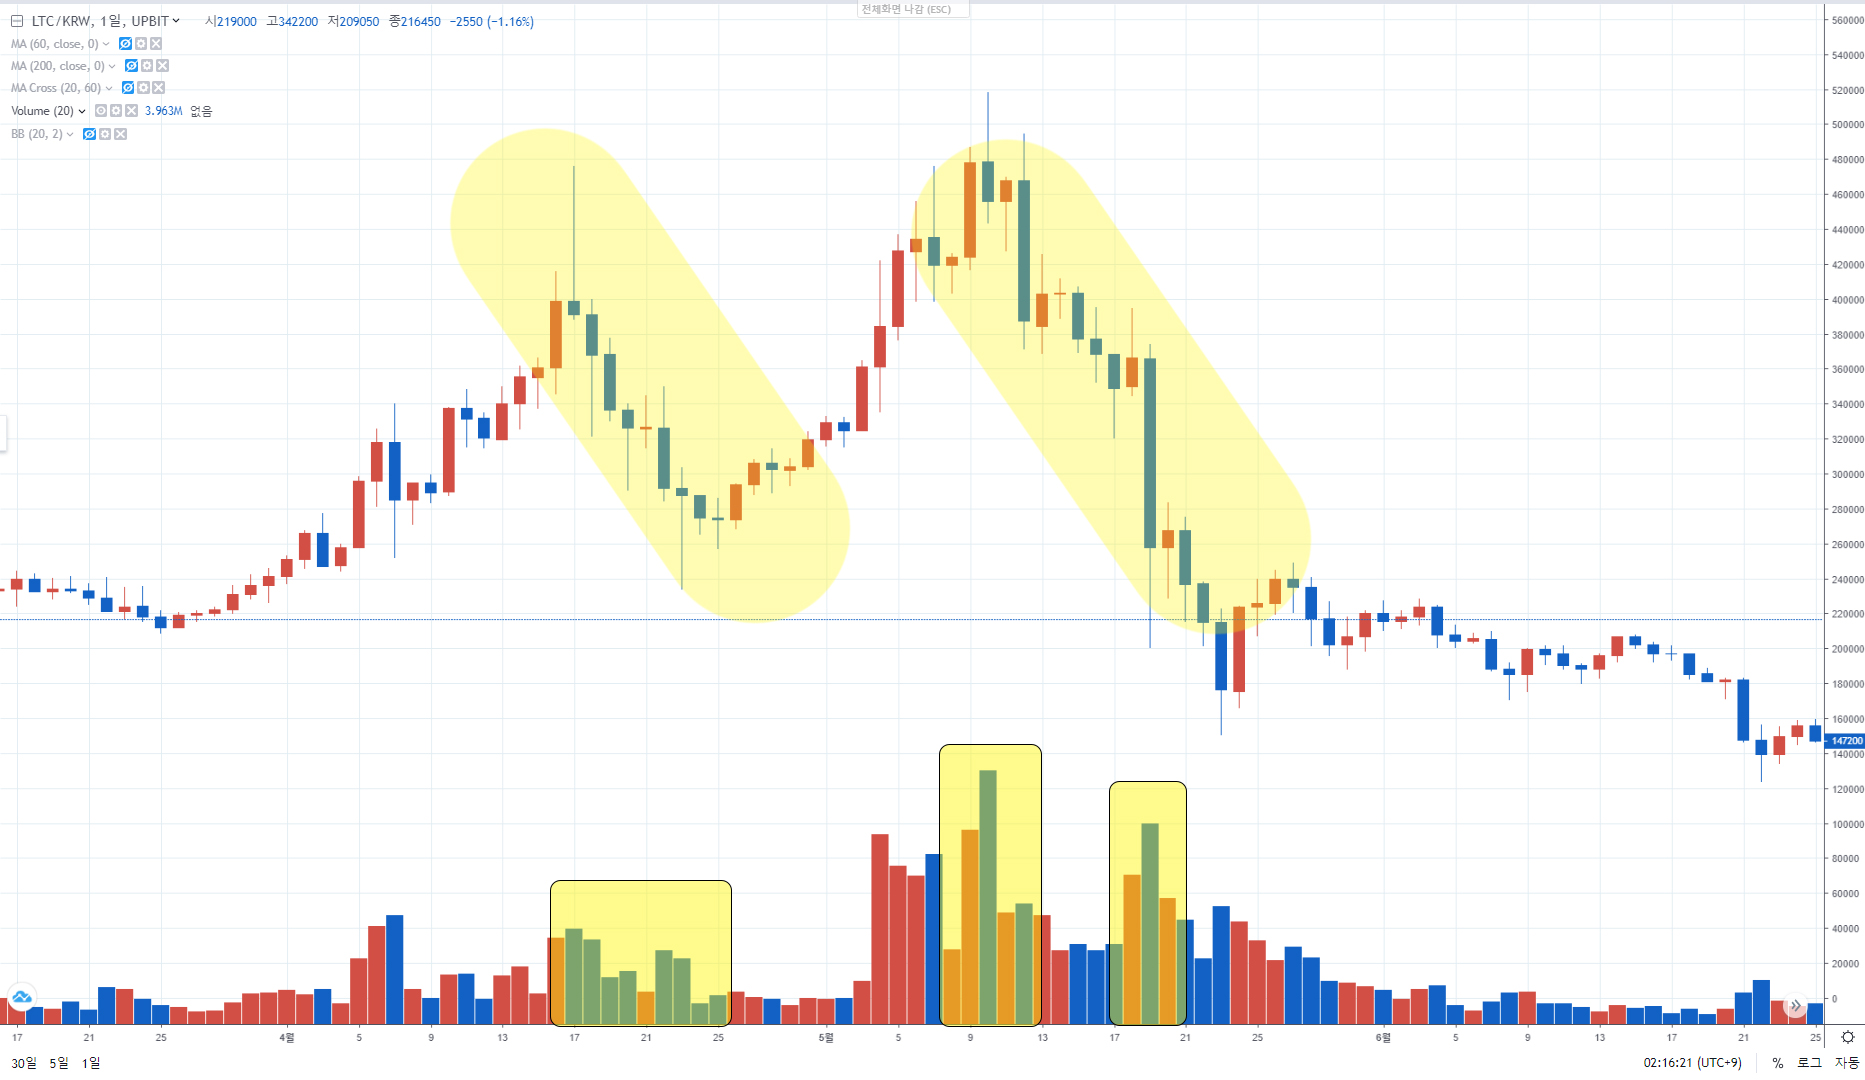
◆ Special matters
The shorter the technical index, the more sensitive but noisy, and the longer the technical indicator, the higher the accuracy, but it is insensitive and a lot of data is omitted.
Therefore, when looking at the trading volume indicator, you can refer to the above and use it according to your strategy.
For example, a swing trader can be viewed as a daily wage, a day trader can be viewed as an hourly wage, and a scalper can be viewed as a 3- to 5-minute wage.
Cryptocurrency is distributed in numerous exchanges around the world due to its nature.
Therefore, market characteristics may differ depending on the type of coin and the exchange used.
|
2021년 해외코인거래소 순위 및 추천 |
|||
|
|
|
|
|
|
거래량 |
11조(1위) |
3.5조 |
9.5조 |
|
레버리지 |
최대100배 |
최대100배 |
최대125배 |
|
수수료 |
- 지정가 : 0.02% - 시장가 : 0.04%(1위) |
- 지정가 : -0.025% - 시장가 : 0.075% |
- 지정가 : -0.025% - 시장가 : 0.075% |
|
거래방법 |
현물+선물+마진 |
선물+주식+FOREX |
선물 |
|
회원가입
|
|||
|
할인코드
|
|||


