
| 2021년 해외코인거래소 순위 및 추천 | |||
 |
 |
 |
|
| 거래량 | 11조(1위) | 1조 | 3.4조 |
|---|---|---|---|
| 레버리지 | 최대100배 | 최대100배 | 최대125배 |
| 수수료 | - 지정가 : 0.02% - 시장가 : 0.04%(1위) |
- 지정가 : -0.025% - 시장가 : 0.075% |
- 지정가 : -0.025% - 시장가 : 0.075% |
| 거래방법 | 현물+선물+마진 | 선물+주식+FOREX | 선물 |
| 회원가입 | 회원가입 | 회원가입 | 회원가입 |
| 할인코드 | 20% 할인 | 5% 할인 | 20% 할인 |
How to overlap trading view charts
2020.07.12 02:53
How to overlap trading view charts
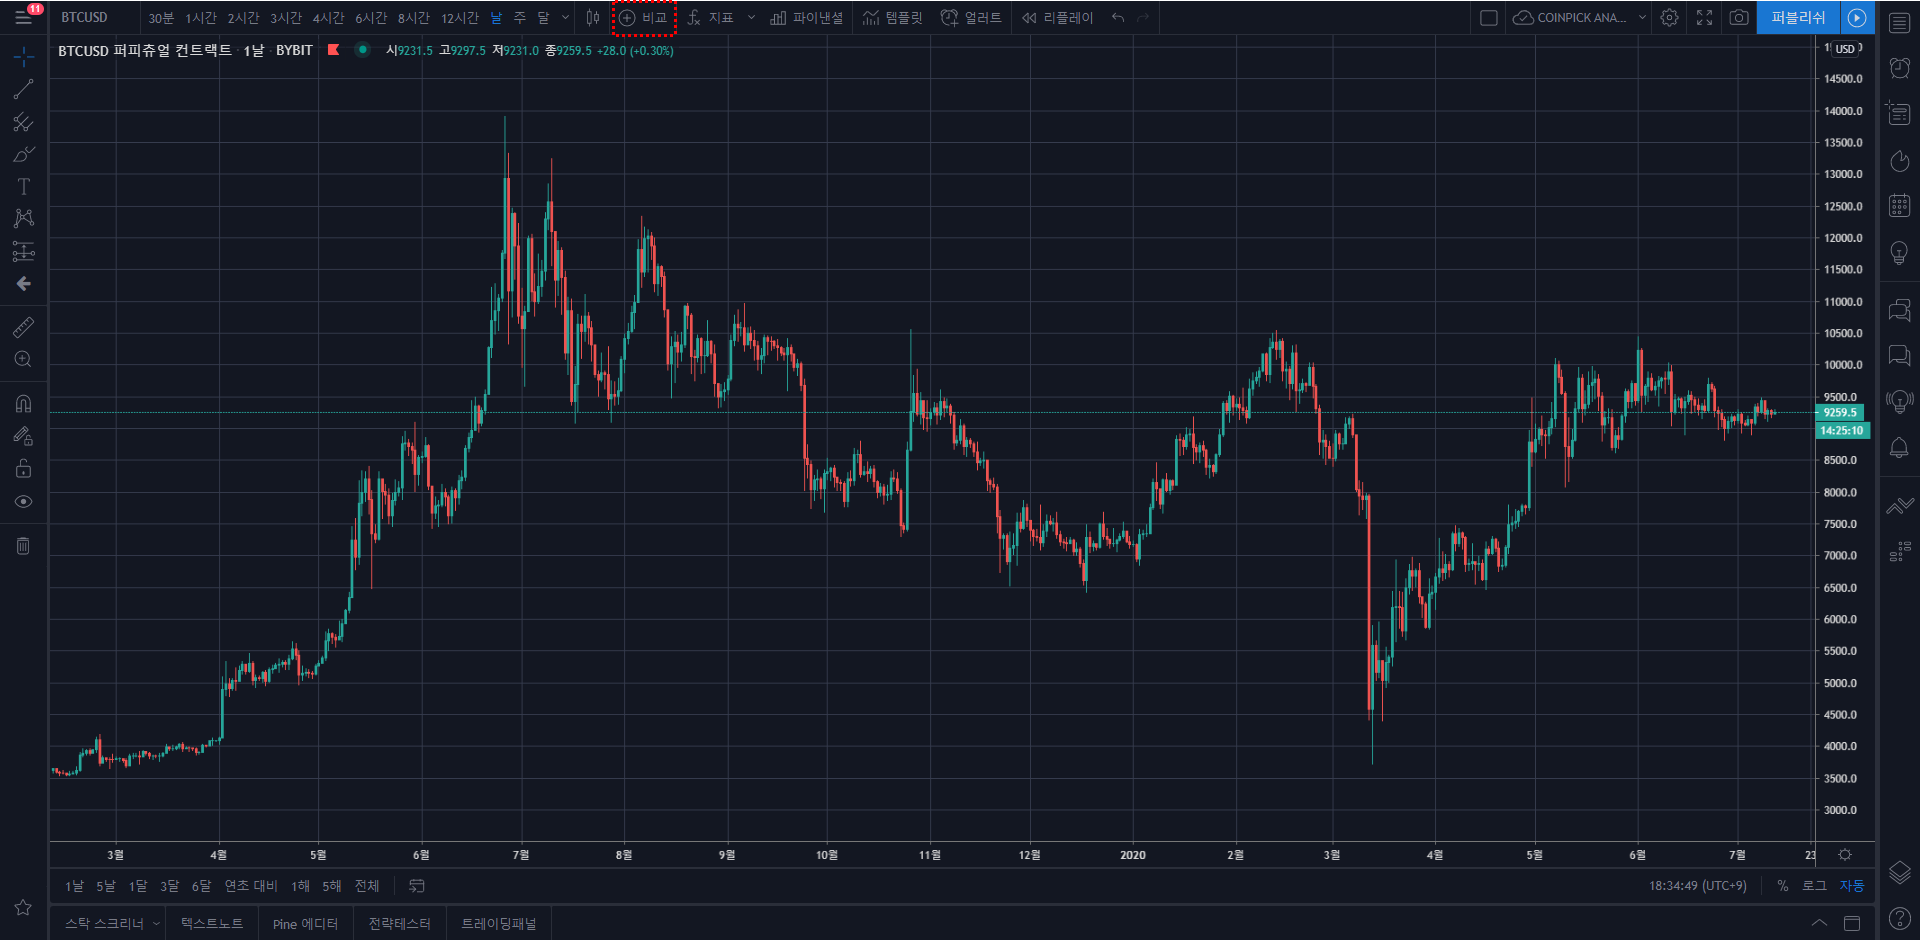
1. First, run the Bitcoin chart on BYBIT. Click "+Compare" on the top bar of the chart.
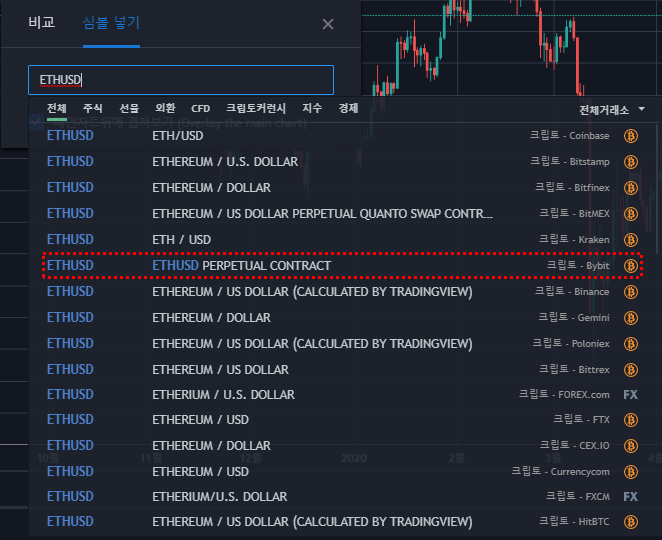
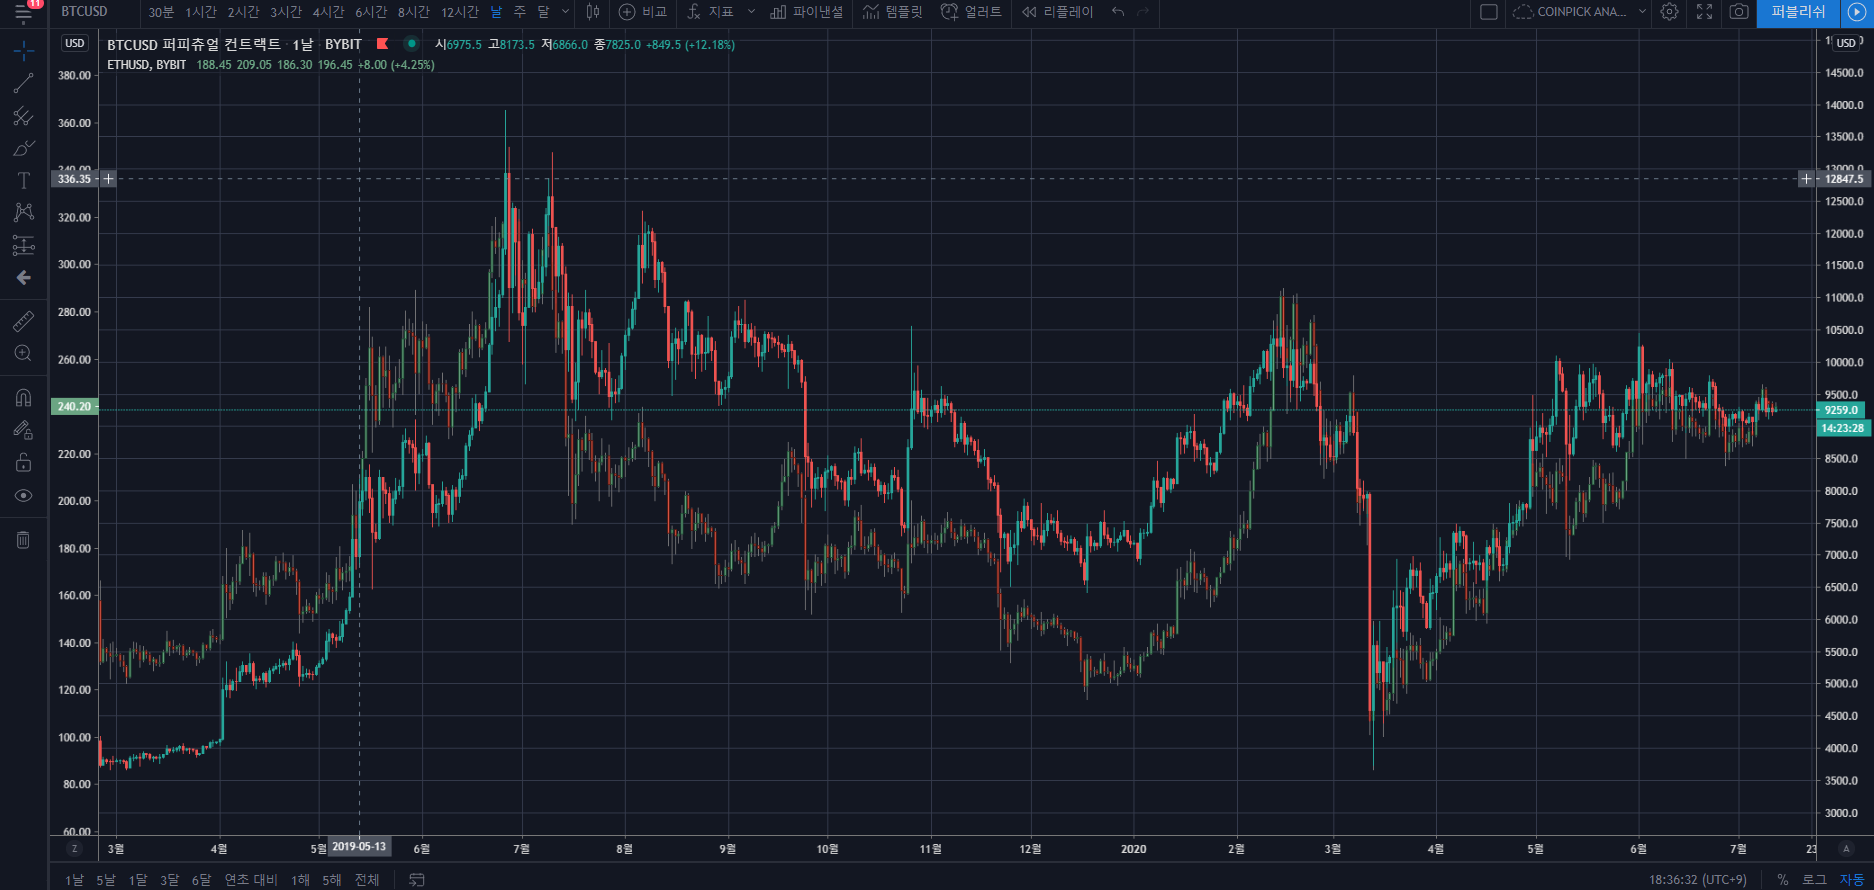
2. Search for ETHUSD and compare BTC and ETH. Bybit is a futures exchange and the coins on the futures exchange are marked as PERPETUAL CONTRACT in Trading View.
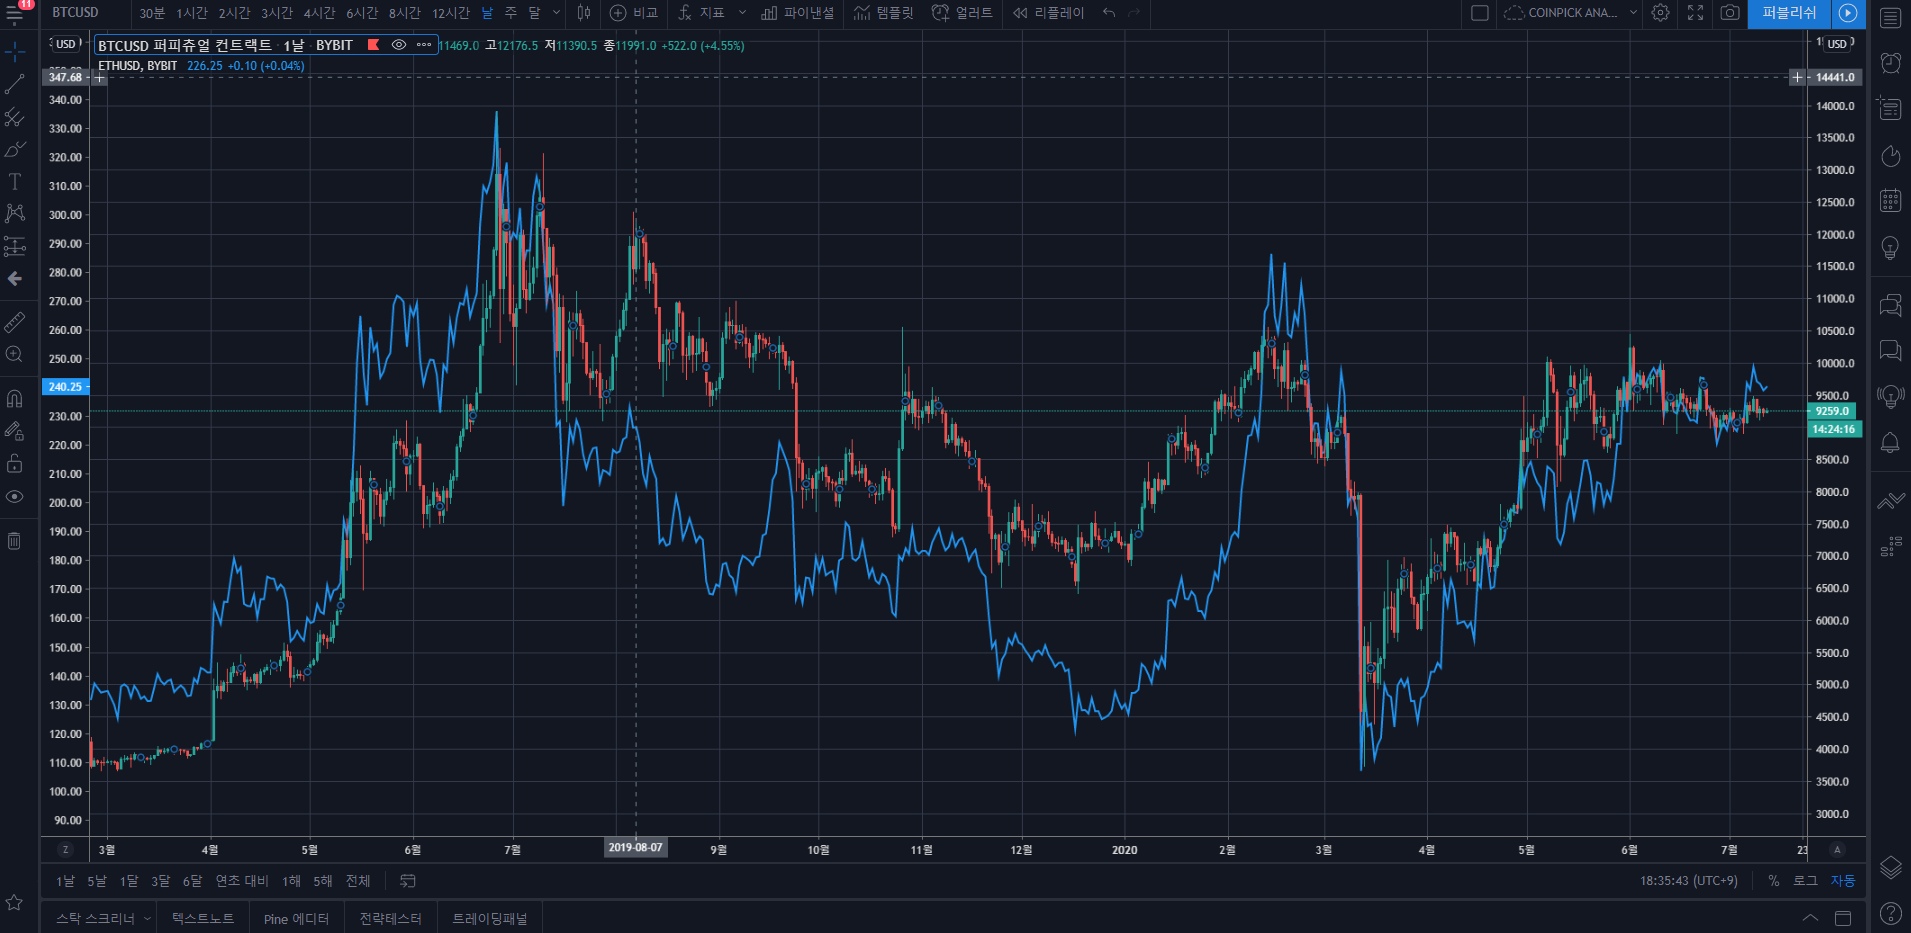
3. Ethereum charts overlap. If you want to change to a candle chart here, double-click the line or click the Ethereum chart setting in the upper left corner.
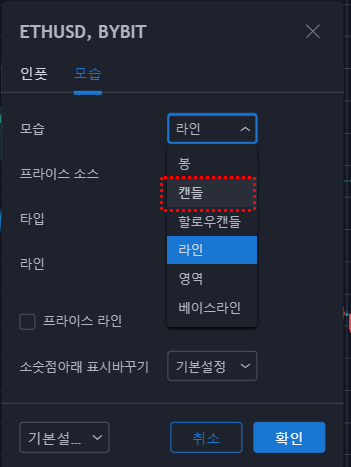
4. Click “Candle” in “Appearance” in Settings. You can also change other settings to your liking.
5. Voila! Bitcoin and Ethereum are superimposed on a candle chart. However, the scale is separated by Ethereum on the left and Bitcoin on the right.
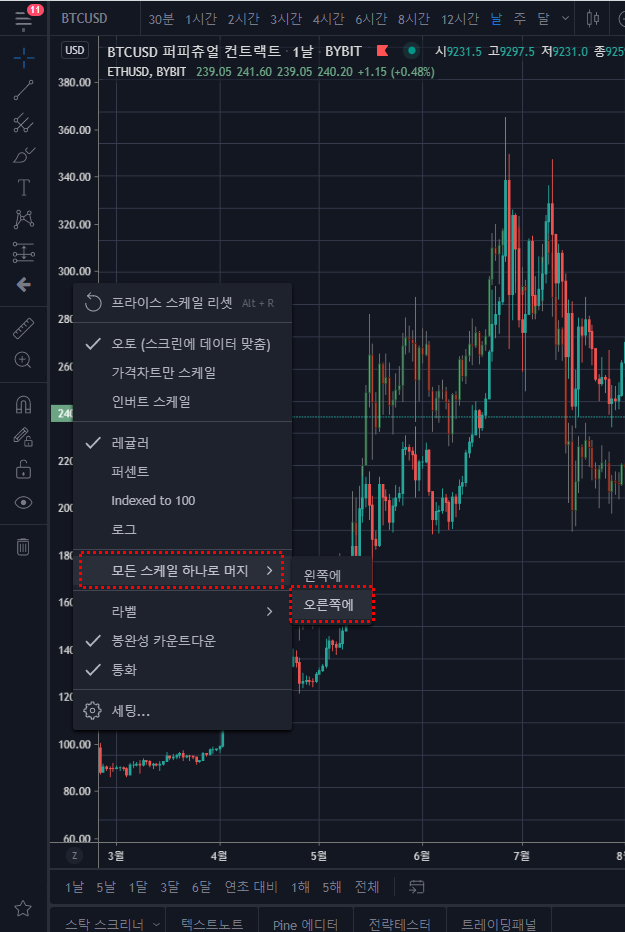
6. After right-clicking on the left scale, click "Merge all scales (overlapping)" and click "Right".
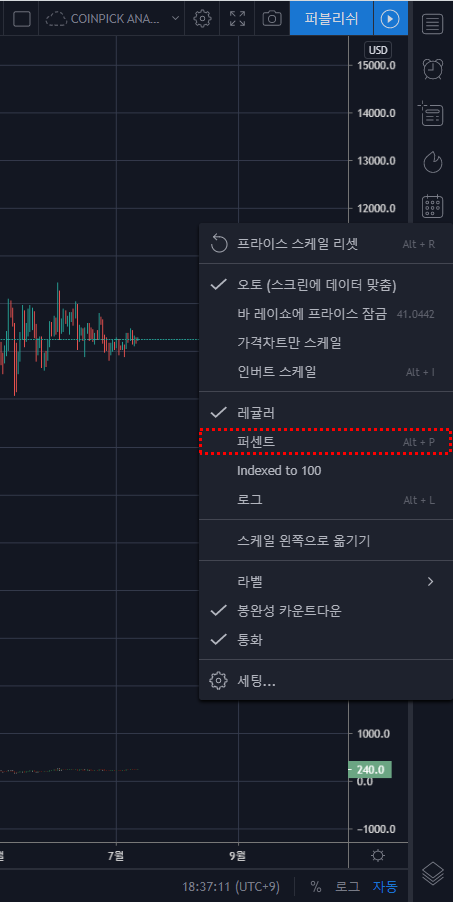
7. Ethereum is in the $200 range, and the bit is close to $10,000, so if you run together, the Ethereum price looks so small that you can't see it on the chart. So, right-click on the right scale and click "Percent".
8. Voila! Bitcoin and Ethereum are now superimposed on a candle chart on a percent-percent basis!
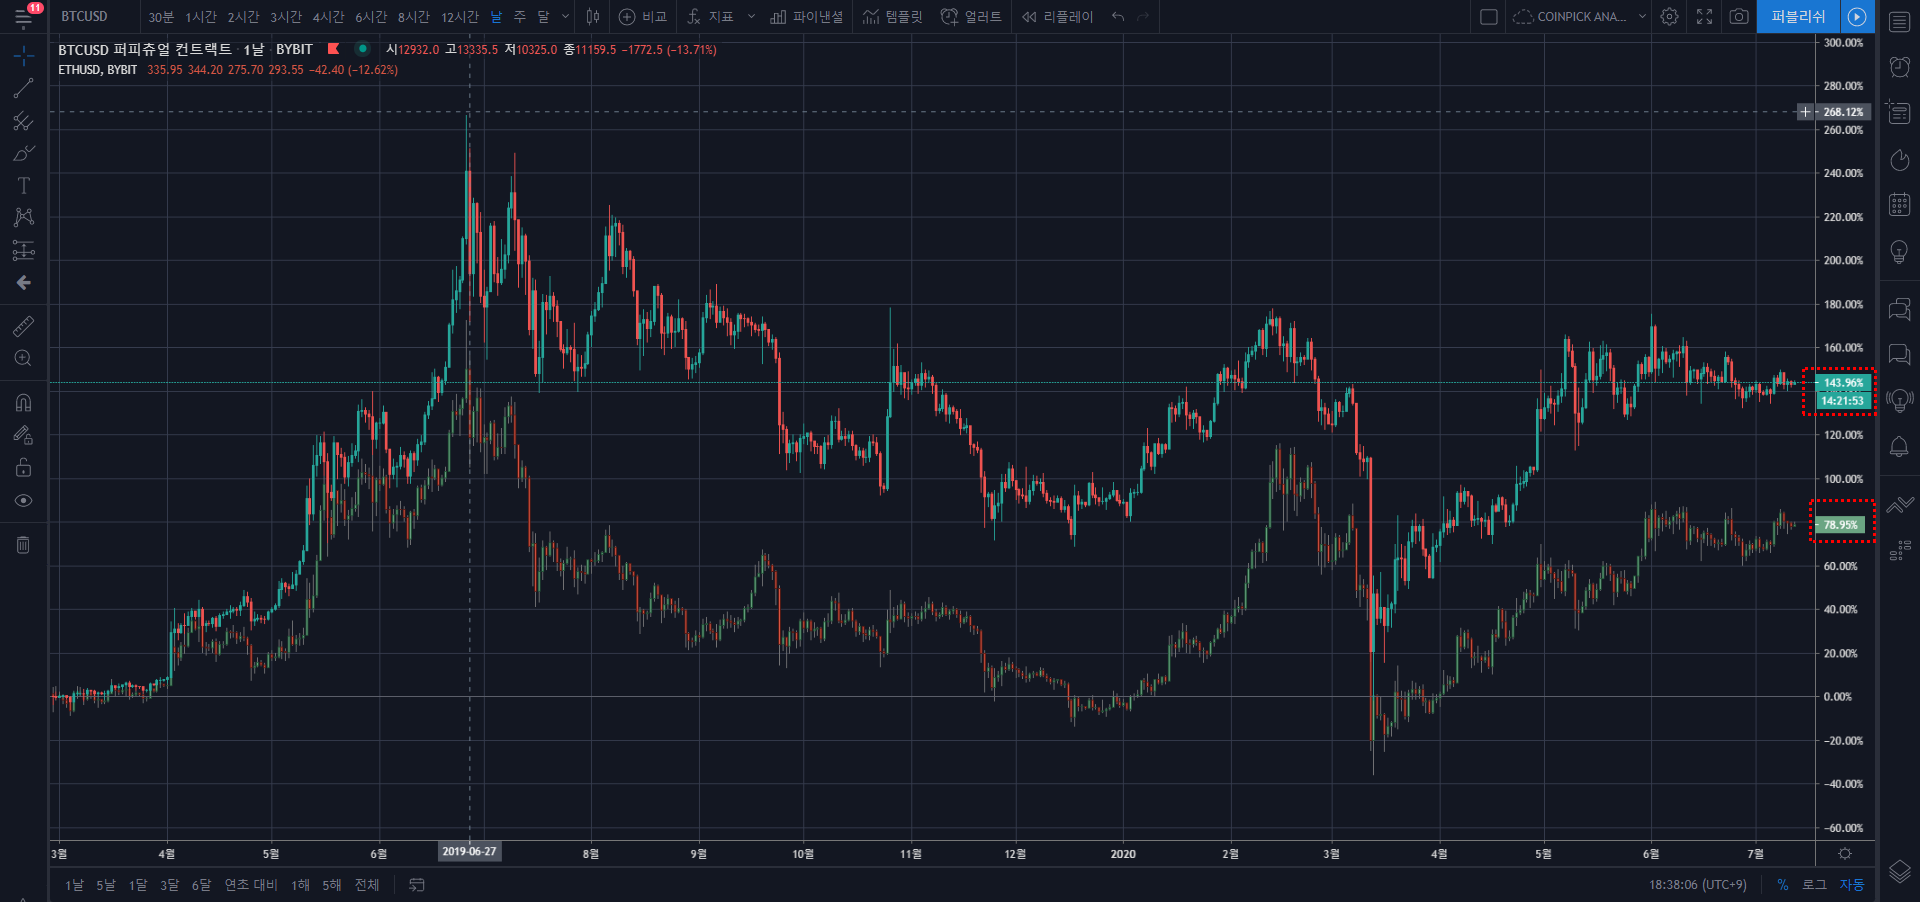
As shown above, it can be observed that the price movements of Bitcoin and Ethereum go up and down together. In a certain section, the bit rises more, and conversely, there is a section where Ether rises more. You can gain insight by observing the charts overlapped in this way.
Then it was the way to overlap the trading view charts!
