| 2021년 해외코인거래소 순위 및 추천 | |||
 |
 |
 |
|
| 거래량 | 11조(1위) | 1조 | 3.4조 |
|---|---|---|---|
| 레버리지 | 최대100배 | 최대100배 | 최대125배 |
| 수수료 | - 지정가 : 0.02% - 시장가 : 0.04%(1위) |
- 지정가 : -0.025% - 시장가 : 0.075% |
- 지정가 : -0.025% - 시장가 : 0.075% |
| 거래방법 | 현물+선물+마진 | 선물+주식+FOREX | 선물 |
| 회원가입 | 회원가입 | 회원가입 | 회원가입 |
| 할인코드 | 20% 할인 | 5% 할인 | 20% 할인 |
How to set up how to view Upbit trading volume
2021.04.14 09:17
How to set up how to view Upbit trading volume

As interest in Bitcoin is growing hot these days, the popularity of cryptocurrency exchanges is also increasing. In this time, we will learn how to set up the trading volume chart of Upbit, the largest cryptocurrency exchange in Korea.
Why Volume Matters
Volume is an indirect indicator of market activity and liquidity to traders. High trading volume means abundant liquidity, and it can be interpreted that trading between buyers and sellers is very active, so it is very useful for chart analysis and trading techniques.
How to set upbit trading volume
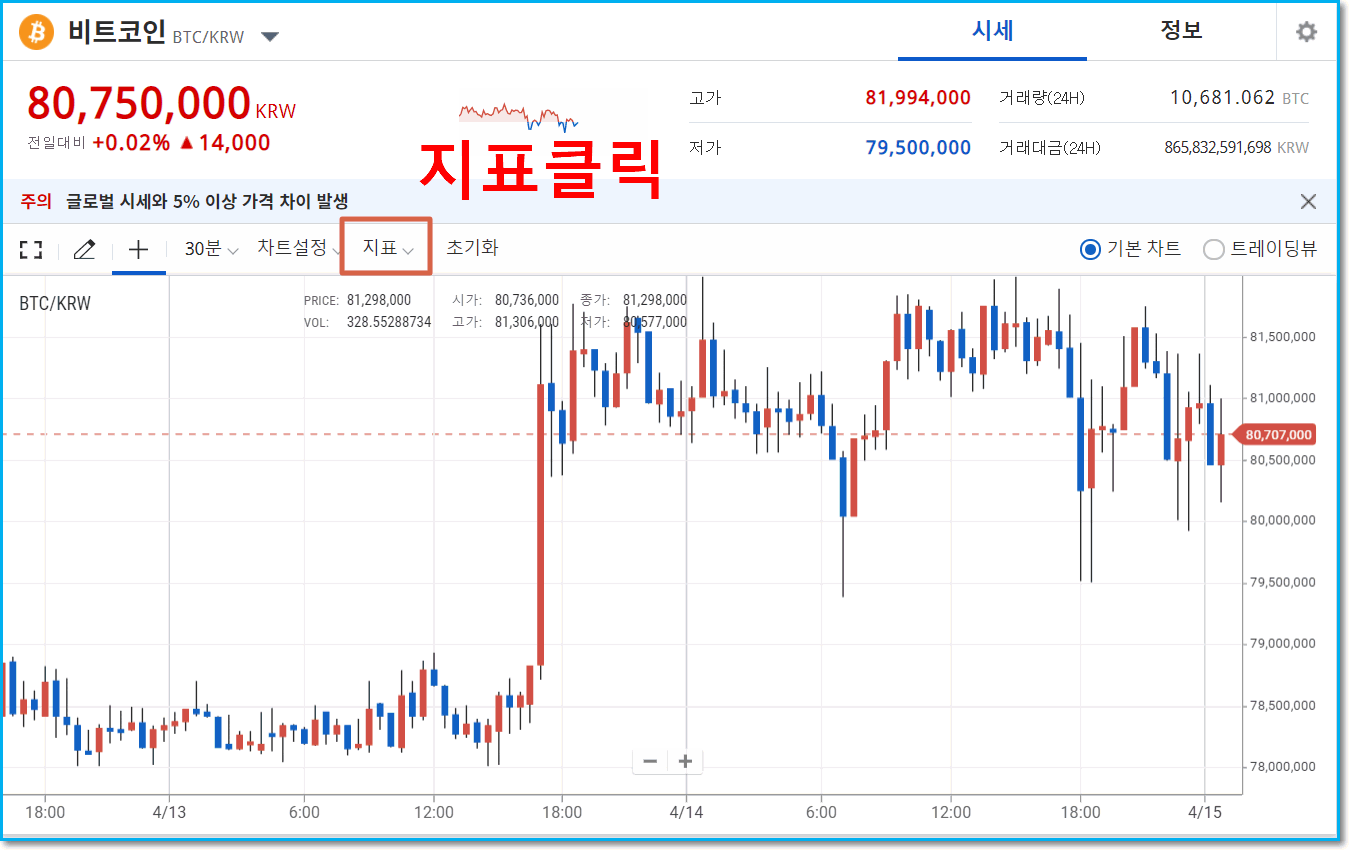
First, we will go to the Upbit main screen. The picture above is a chart provided by Upbit by default. This is a candle chart where you can see the price of Bitcoin. To add a volume indicator to this chart, let's click on the checkboxed indicator.

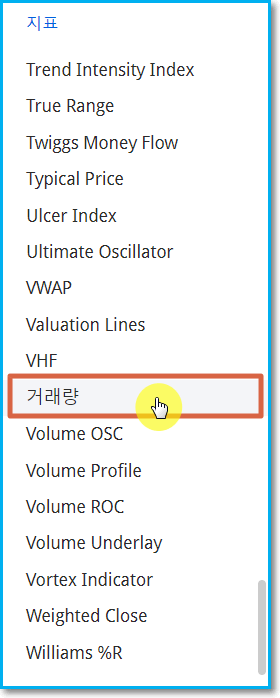
If you click on an indicator, you can select various indicators as shown in the image above. This time, we will select the trading volume we are going to look at. Kindly note that 'transaction volume' is displayed in Korean. Please note that in some cases it is simply displayed as VOL in English.

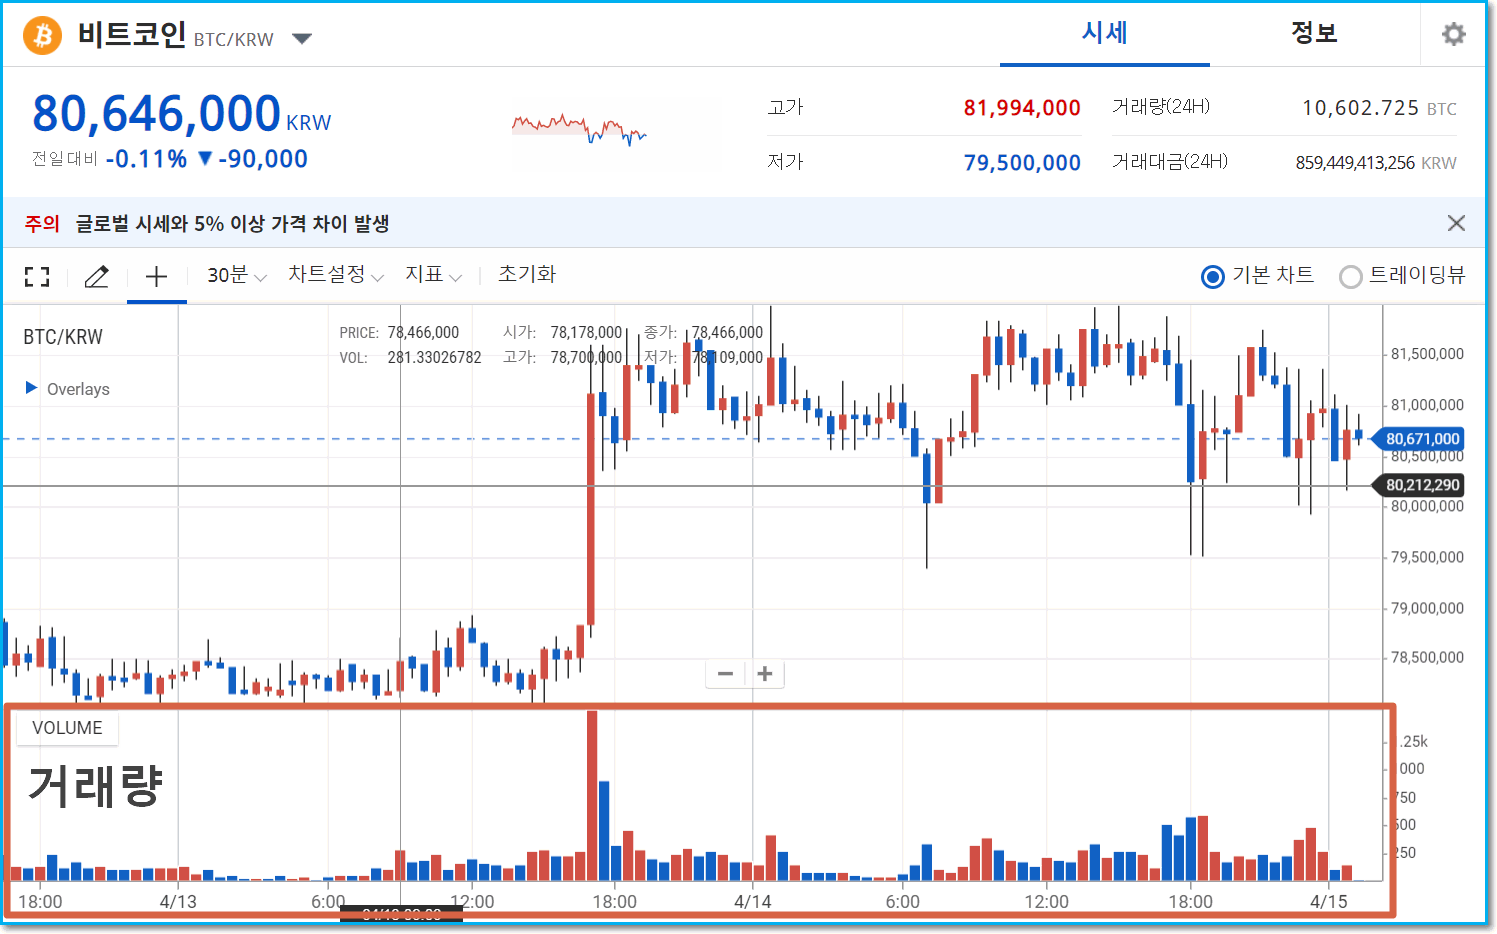
If you select the trading volume, you can check the trading volume by time set under the candle chart as shown in the picture above. Simple, right? Please use the above method to select the necessary indicators and create your own chart.
In the future, I will post about how to use Upbit, which many people are curious about, so please pay attention. See you again next time~
댓글 0
| 번호 | 제목 | 글쓴이 | 날짜 | 조회 수 |
|---|---|---|---|---|
| 공지 | How to Transfer and Send Bitcoins with Binance | 모나코 | 2021.03.01 | 3182 |
| 공지 | How to open an Upbit K-Bank account (deposit, withdrawal) | 모나코 | 2021.02.26 | 389 |
| 9 |
How to buy Tether (USDT) on Upbit? (Deposit, withdrawal, currency exchange, etc.)
| 모나코 | 2021.04.29 | 2711 |
| 8 |
How to use UPbit in 2021
| 모나코 | 2021.04.23 | 620 |
| 7 |
Upbit vs Bithumb vs Binance Fee Comparison!
| 모나코 | 2021.04.22 | 1358 |
| 6 |
How to use Upbit App (APP)
| 모나코 | 2021.04.20 | 365 |
| 5 |
Upbit trading plan in 2021 (Buy, Sell)
| 모나코 | 2021.04.19 | 262 |
| 4 |
How to see the call window in Upbit
| 모나코 | 2021.04.15 | 4159 |
| » |
How to set up how to view Upbit trading volume
| 모나코 | 2021.04.14 | 3105 |
| 2 |
How to transfer bitcoins from Upbit --> Bybit
| 모나코 | 2021.03.02 | 626 |
| 1 | How to hit upbit short, trade method (short selling) | 제육볶음 | 2021.02.21 | 4262 |


