

1. How to set up Binance Charts
In this time, we will learn how to set up charts on Binance Exchange.
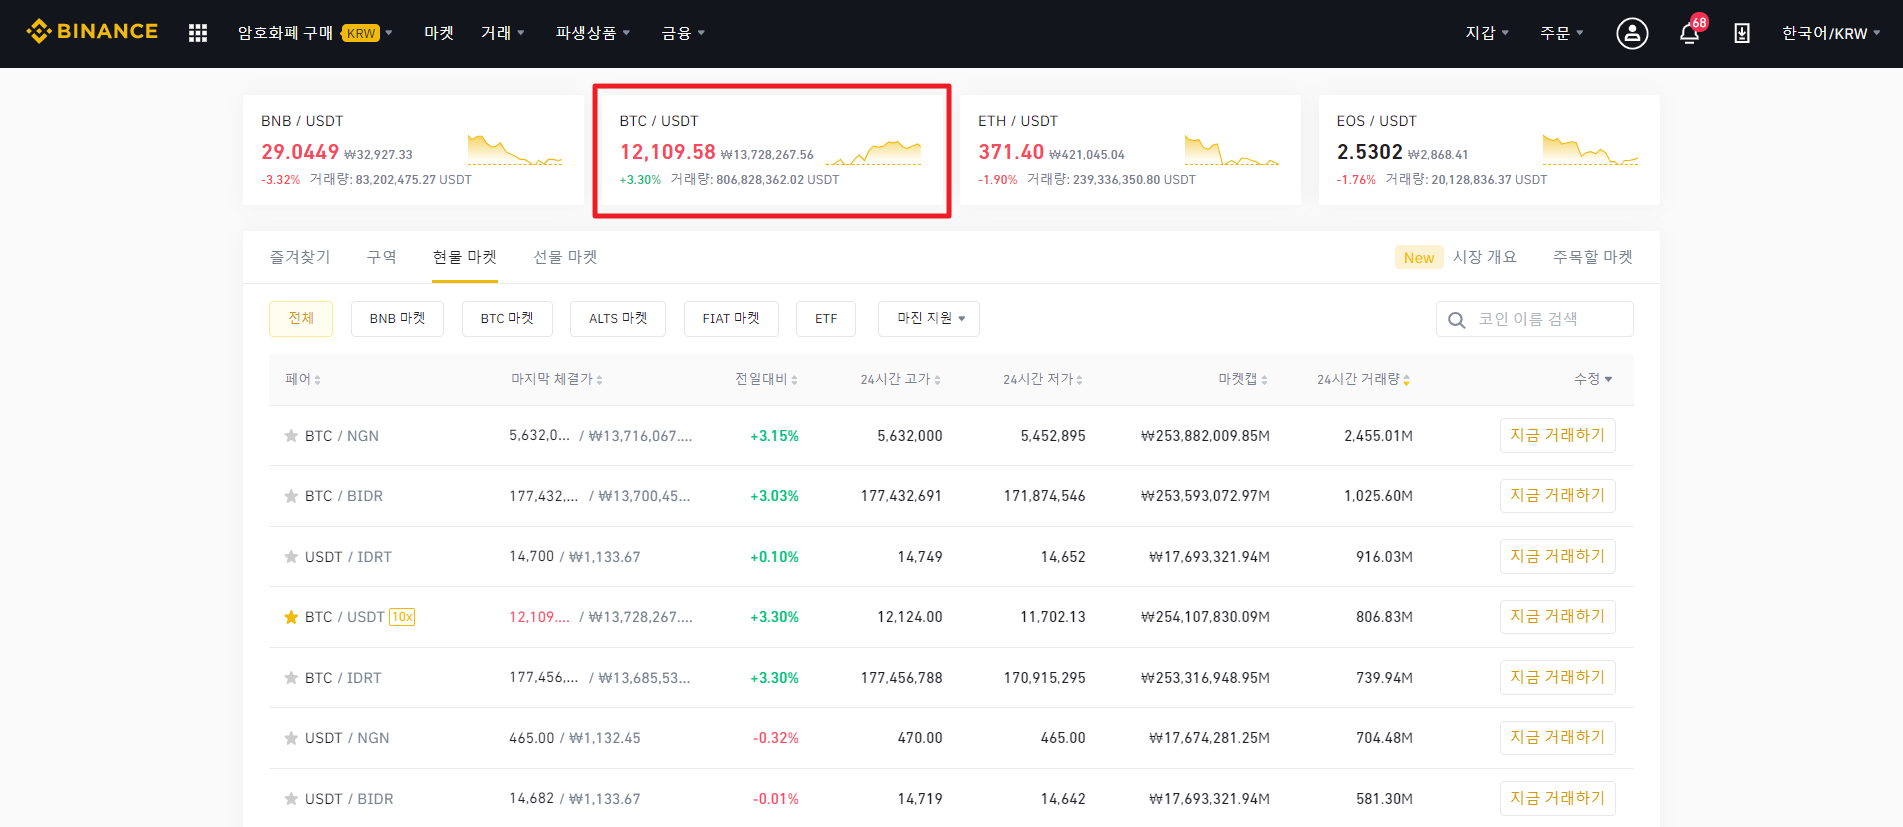
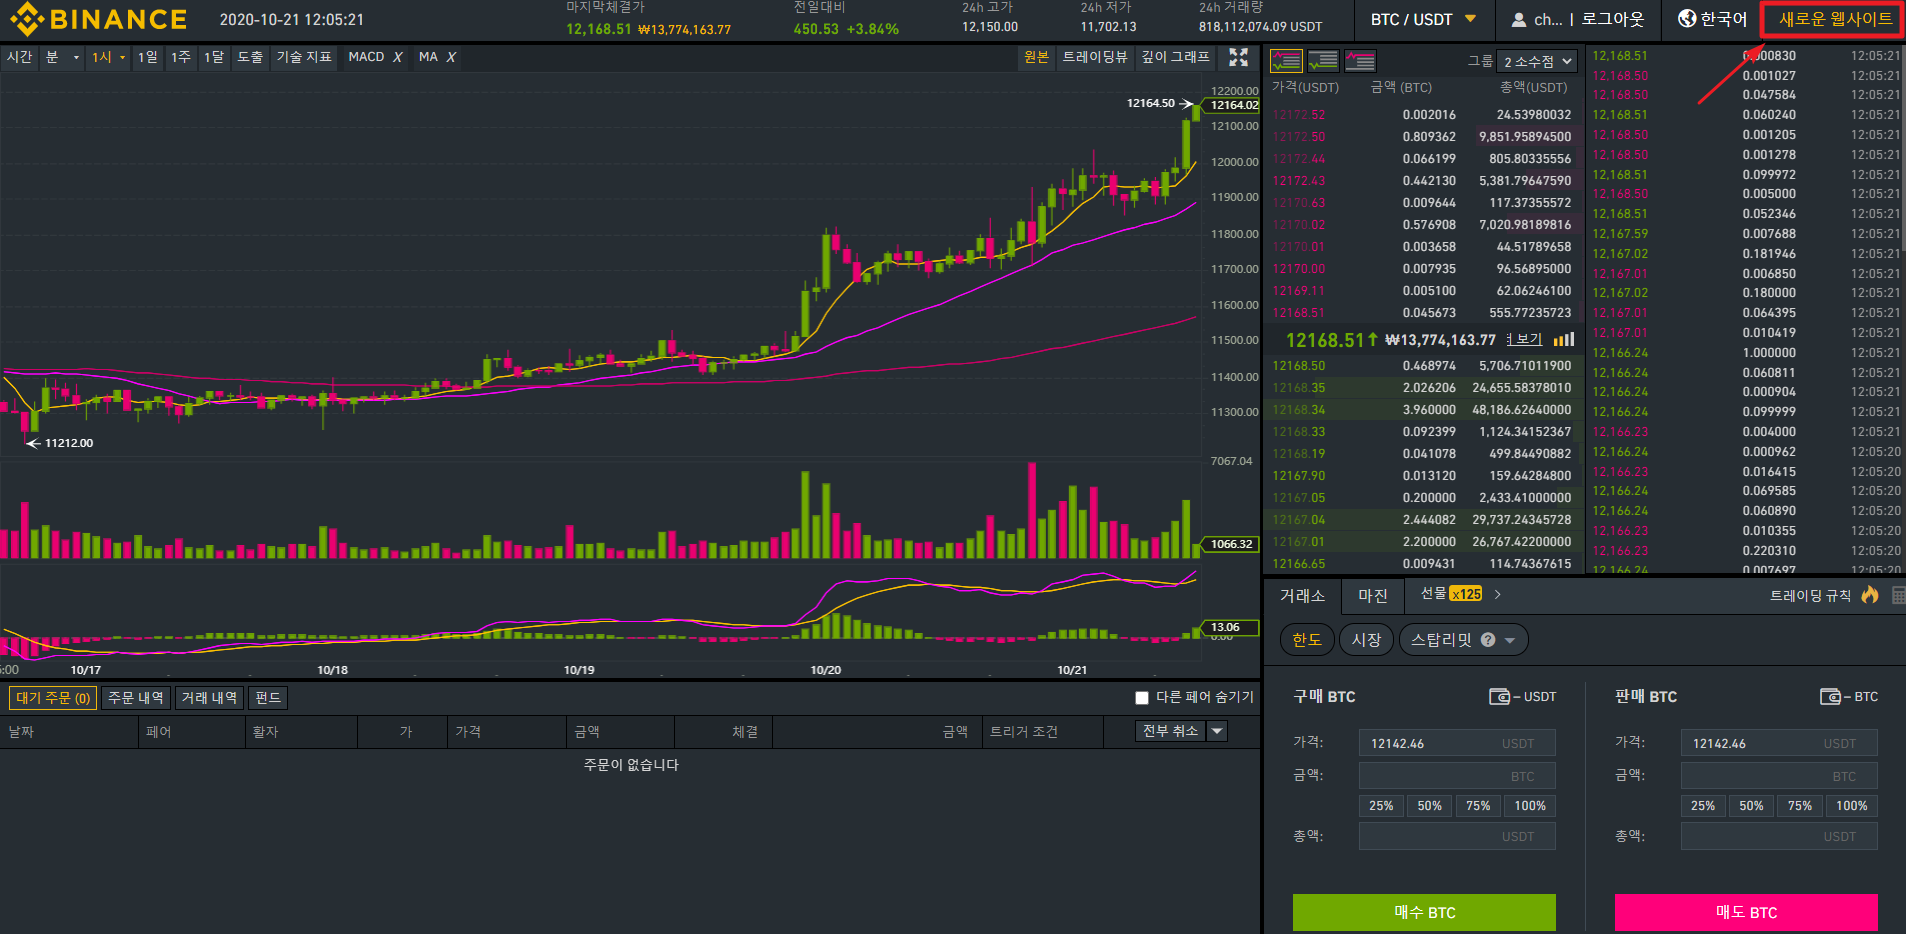
1. First, go to the domain and select the virtual asset you want to trade (eg Bitcoin / Tether).
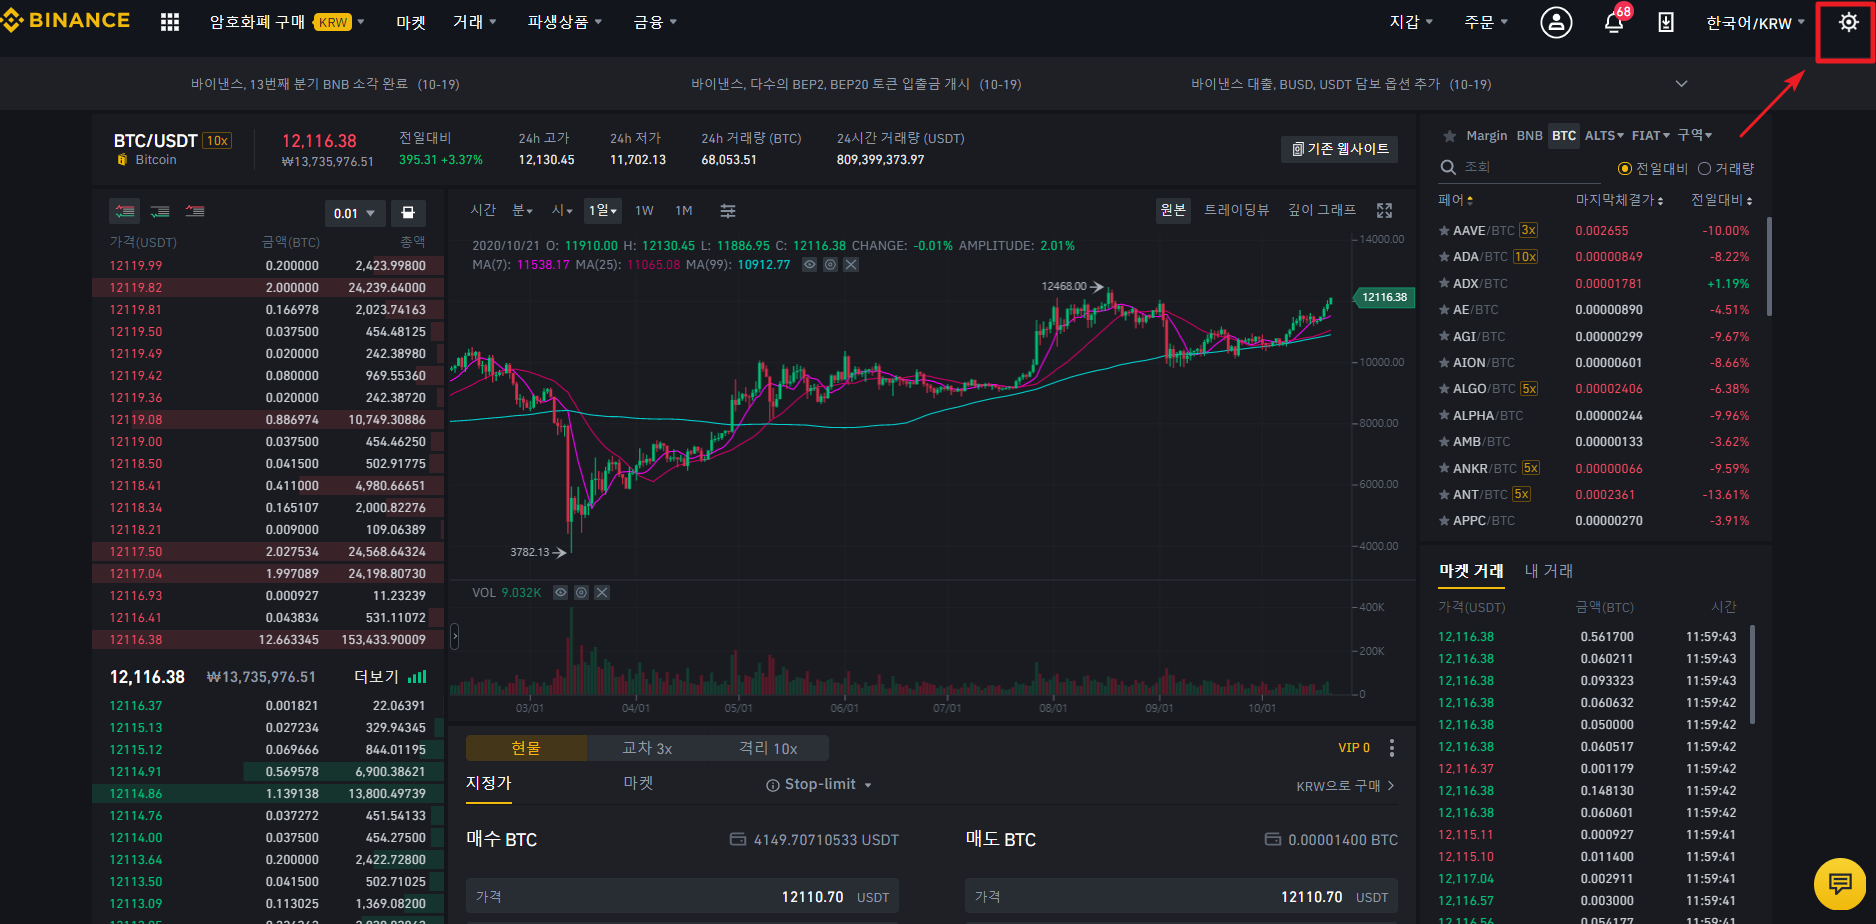
2. You will be moved to the chart screen as shown below. You can edit settings by clicking the gear icon in the upper right corner.
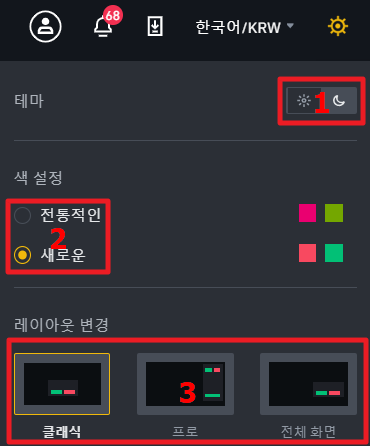
3. Here, there are bright screen, old and new color, and three layouts. You can set it as you like.
4. And you can use Binance Charts before the update by clicking on the old website right above. Those who have been using Binance Exchange for a long time may find the charts more comfortable today, so Binance seems to have taken it into consideration.
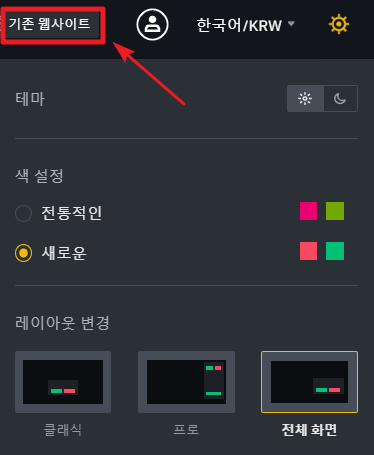
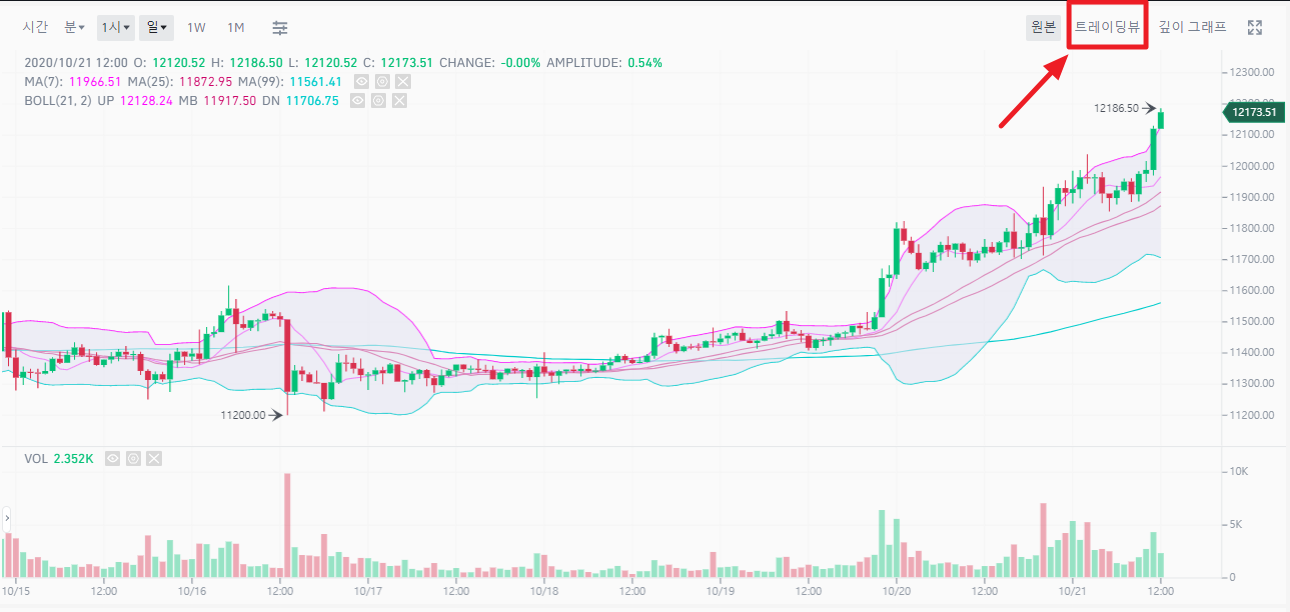
5. Below is the existing website. Click New Website in the upper right corner to return to the original page.
6. Now, I will explain the chart in earnest.
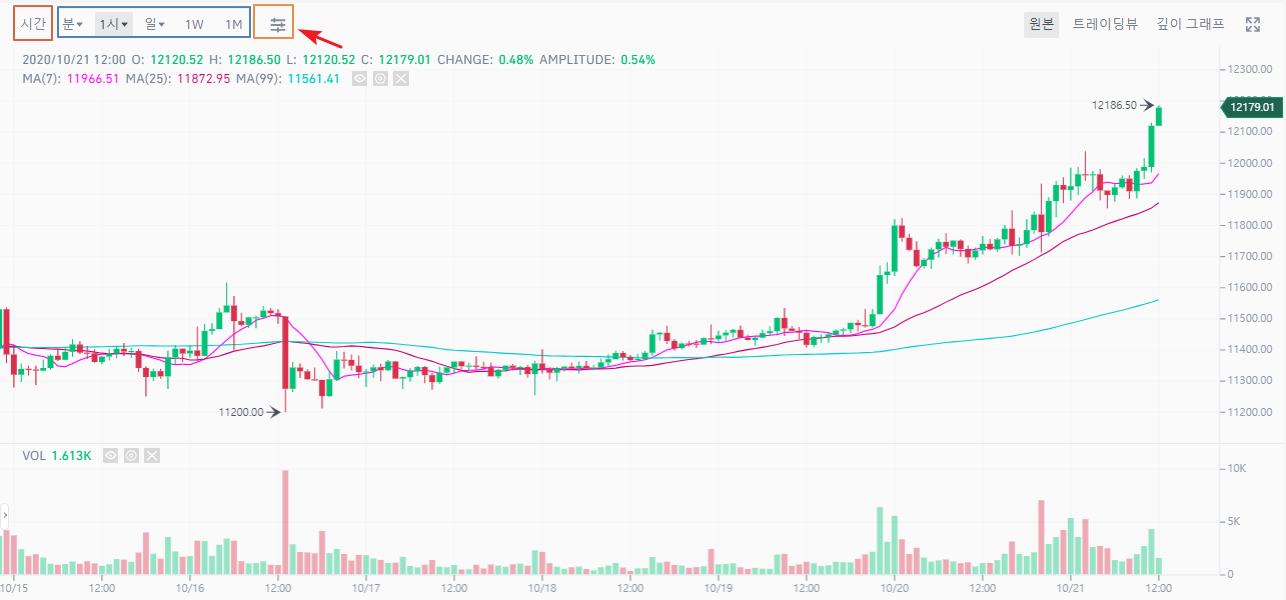
If you look at the upper left corner, you can see Hour / Minute / Hour / Day / 1W / 1M / Indices setting.
Time: Click the icon to turn the candle chart into a line chart. (translation error?)
Time frame: You can view the chart by setting the desired time unit.
Indicator setting: Click the corresponding icon to use various types of simple indicators.
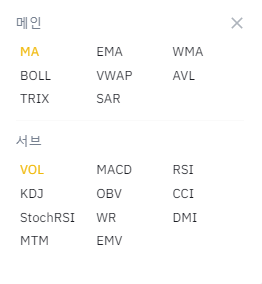
7. Let's set up the indicators. If you click the indicator setting icon, the following options are available.
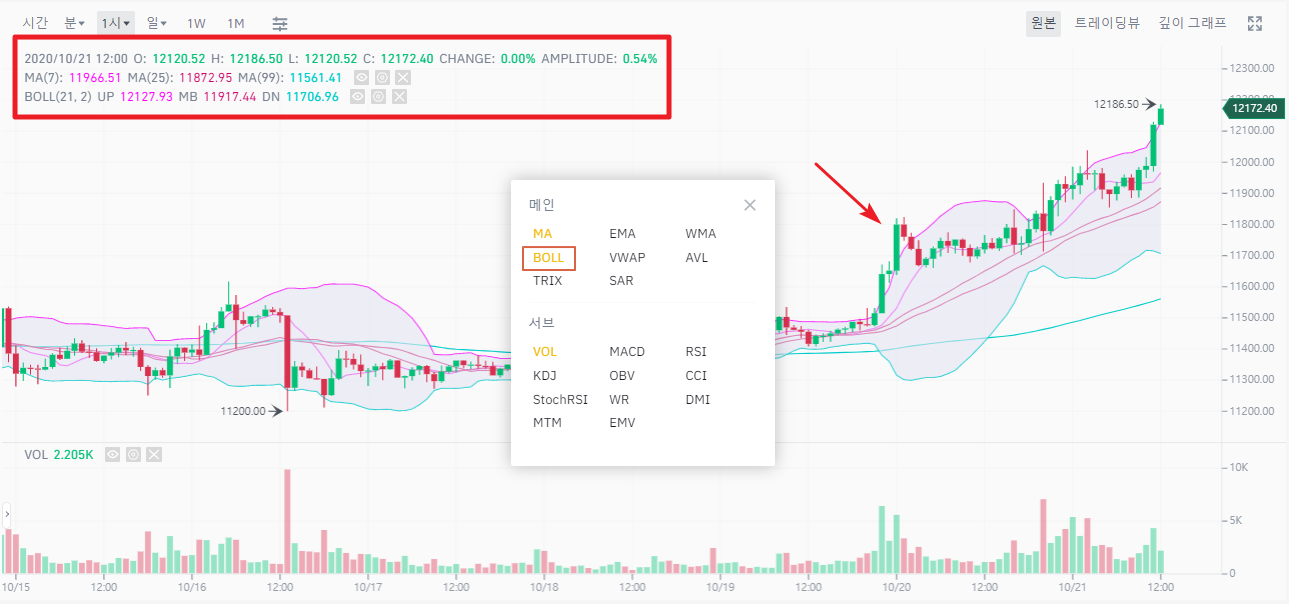
8. I selected BOLL (Bollinger Bands) and applied it to the chart. The indicator being used is shown in the upper left corner. You can edit the settings here.
9. Next, we will explain the functions in the upper right corner. If you look at the upper right corner, there are original/trading view/depth graph and full screen settings.
Source: Current chart
Trading View: Go to Trading View Chart, more functions are available.
Depth graph: You can observe the buy/sell items in the asking price window at a glance.
Full screen: The chart is applied to the full screen.
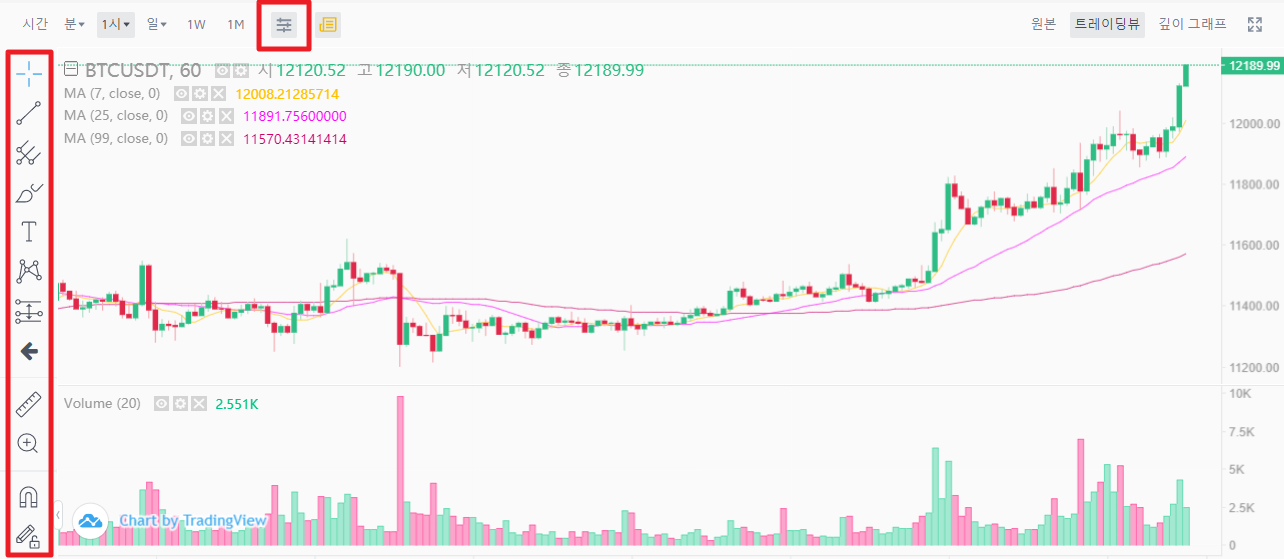
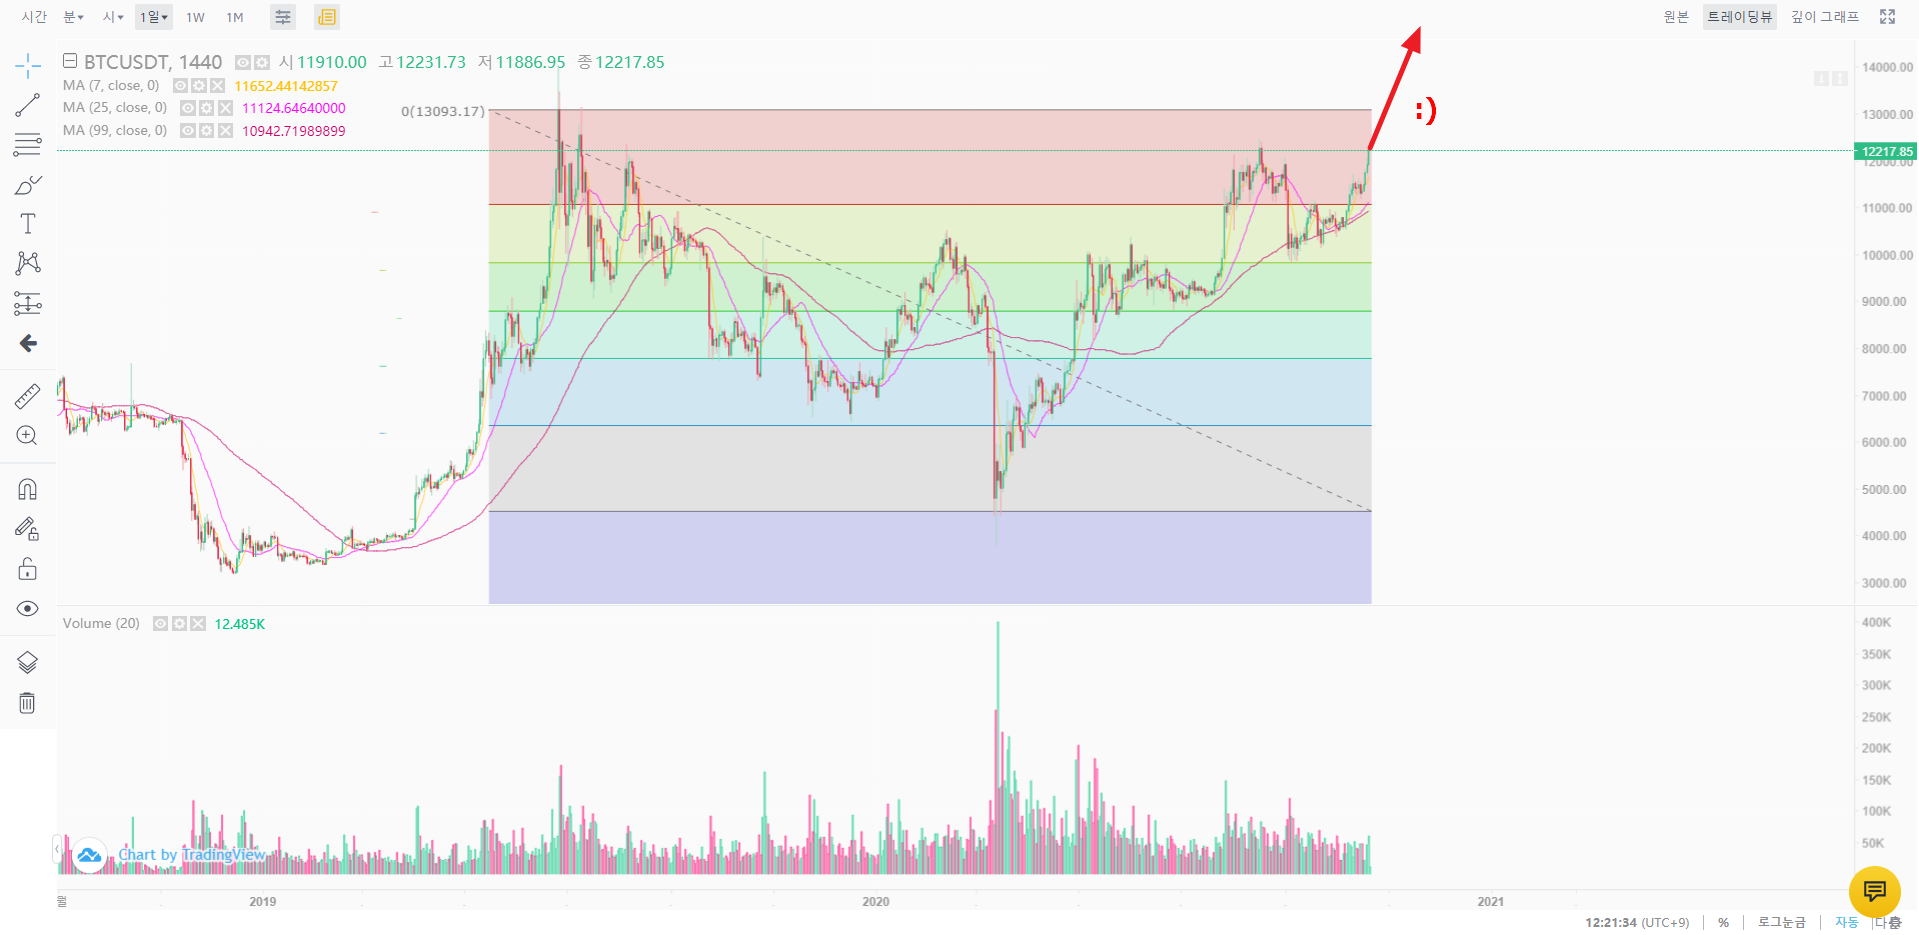
10. Below is what it looks like after clicking on the Trading View chart. It is equipped so that you can draw the desired line on the left.
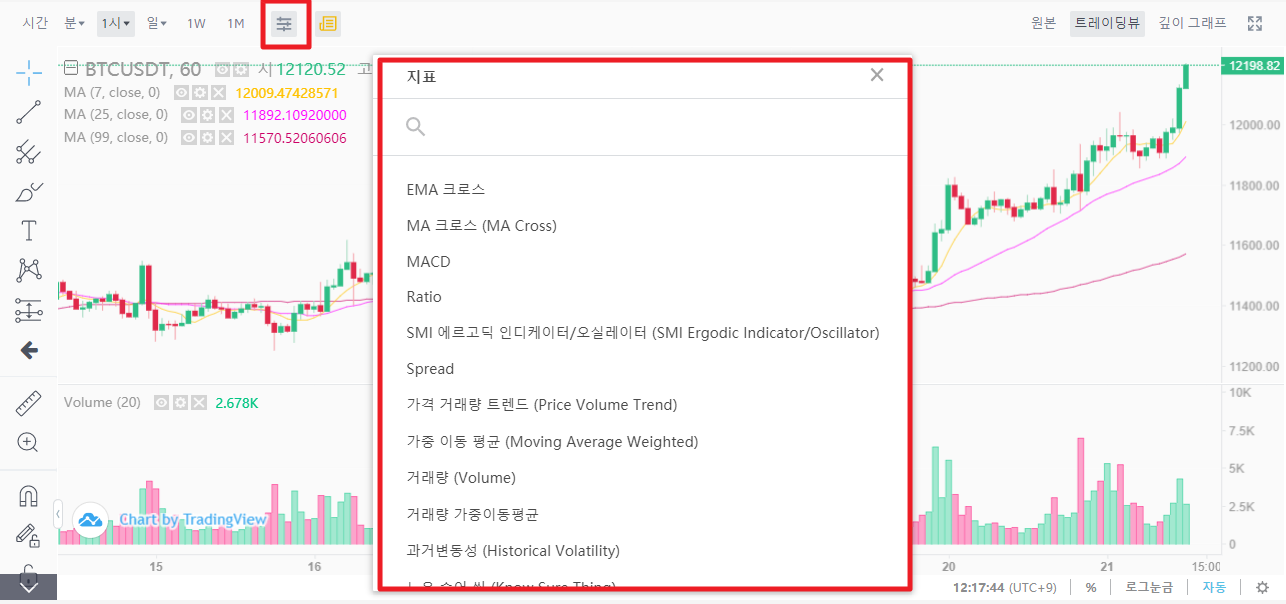
11. The indicator setting in the Trading View chart supports more indicators as shown below.
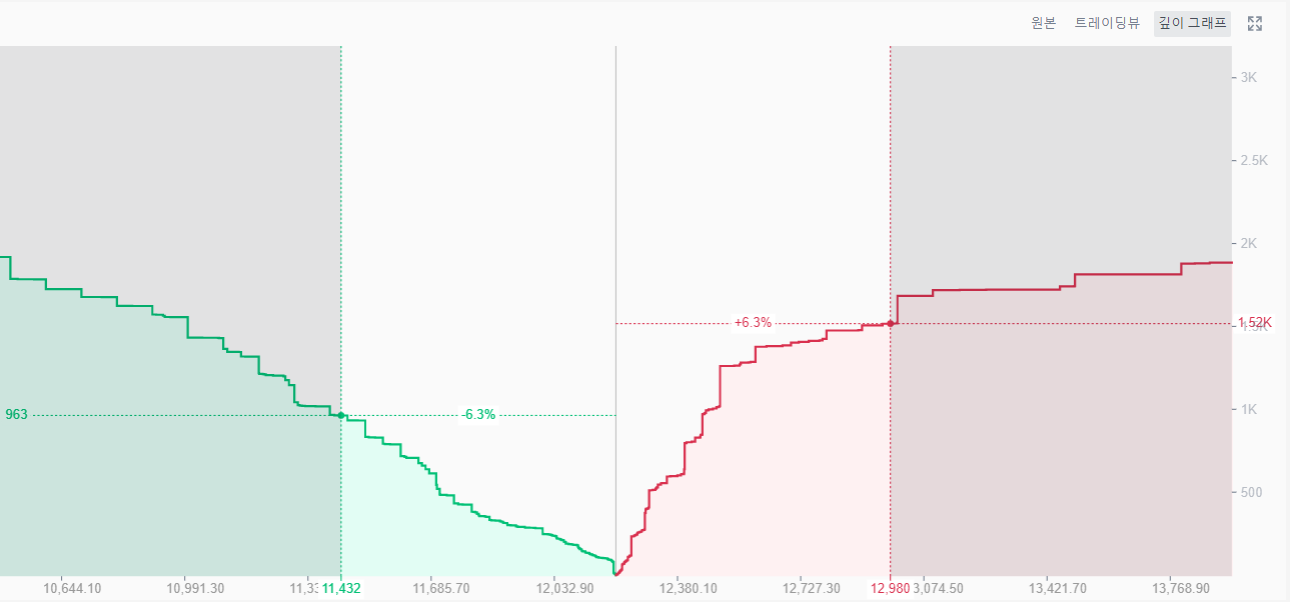
12. Let's look at the depth graph.
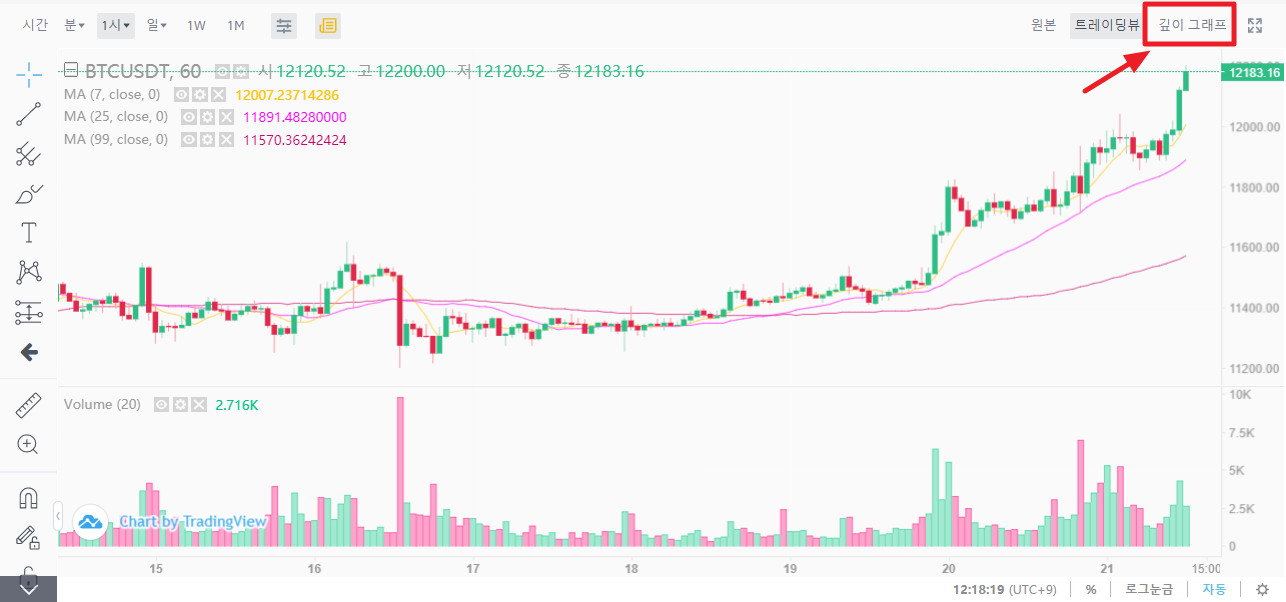
You can see the listings below.
You can use this to visually see the up and down pressure.
Let’s Go Bitcoin!
|
2021년 해외코인거래소 순위 및 추천 |
|||
|
|
|
|
|
|
거래량 |
11조(1위) |
3.5조 |
9.5조 |
|
레버리지 |
최대100배 |
최대100배 |
최대125배 |
|
수수료 |
- 지정가 : 0.02% - 시장가 : 0.04%(1위) |
- 지정가 : -0.025% - 시장가 : 0.075% |
- 지정가 : -0.025% - 시장가 : 0.075% |
|
거래방법 |
현물+선물+마진 |
선물+주식+FOREX |
선물 |
|
회원가입
|
|||
|
할인코드
|
|||


