

1. How to look at the shape of the candle
◆Candle Basics
The following descriptions are based on daily wages.
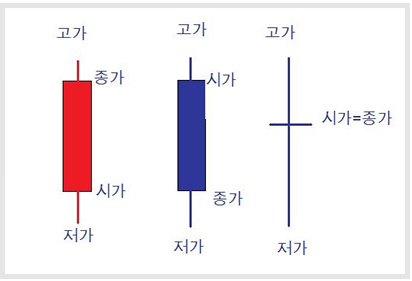
If the closing price (the price after the end of the transaction) and the opening price (the price at the start of the transaction) is higher than the opening price, a red bar is drawn and this is called a 'positive bar'. Conversely, when the closing price is lower than the opening price, a blue bar is drawn and this is called a ‘negative bar.*
The candle (stick) is marked with a body and a tail as shown above, and the tip of the upper tail means the highest price during the market and the tip of the lower tail means the lowest price during the market.*
(1) If you look at the red positive bar on the left of the image above, it is interpreted that today's stock price starts at the opening price, hits a low, rises again, hits a high price, and then ends with the closing price, which is a slightly lower price.
(2) If you look at the blue negative bar, it is interpreted that it starts at the open price, hits a high price, then falls again to a low price and ends at the close price, which is a cautiously rising price.
(3) The last, right-most cross-shaped candle shows the high and low after the start of trading, and the last determined closing price is the same as the opening price.
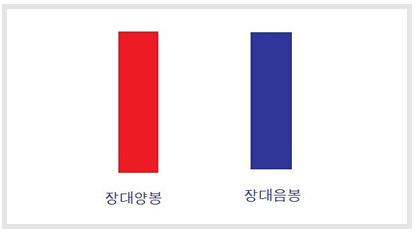
◆ Long Positive Bar
It is a pattern in which the market price starts at a low price and then rises and closes at a high price on the same day.
- When such a long positive bar occurs at a low point, it is interpreted as a signal to signal an uptrend reversal.
◆ Long Negative Bar
Conversely, it is a pattern in which the opening price starts at the highest price and continues to decline during the day, ending at the closing price.
- This is a typical downtrend, and the long black bar accompanied by a large amount at this time can be interpreted as a strong downtrend.
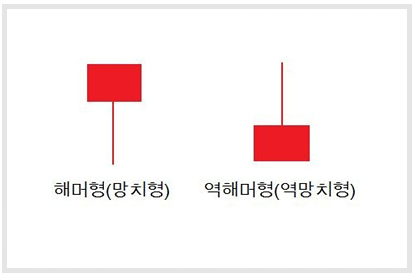
◆ Hammer-shaped
hammer-shaped candle
- If it occurs during a downtrend, it is highly likely to turn into an uptrend
◆ Reverse hammer-shaped
Reverse hammer-shaped candle
- If it occurs during a downtrend, it is a transition signal to an uptrend.
- Occurs in the high zone, implying a short-term correction.
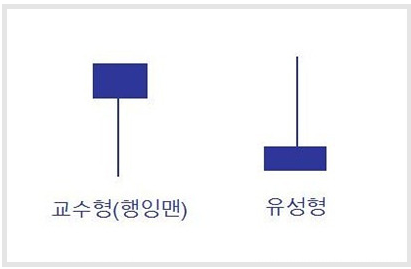
◆ Hanging (Hanging Man)
Negative bar with lower tail
- If it occurs in an uptrend, it is implied that a reversal is possible in a downtrend
- If it occurs at the low point, it is an upturn signal.
◆ Planetary
Negative with upper tail
- If it occurs during an uptrend, it will turn into a downtrend
- Occurs in an uptrend that has risen a lot, suggesting a correction to the high
- If it occurs in a downtrend, it implies further downtrend.
- A candle shape that appears frequently in the early stages of accumulating bottom forces
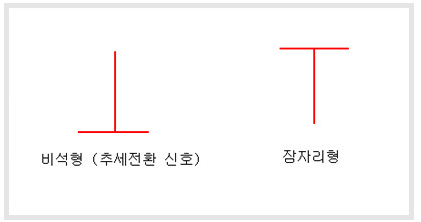
◆ Zeolite (Trend reversal signal)
The opening and closing prices are the same, and the upper tail is shaped like a cantle.
- If zeolite candles continuously appear in the bottom, it is interpreted as accumulating power without leaving the trough.
- If a zeolite candle occurs in the high point, it is a signal that a top-down is imminent. Warning of a downtrend
◆ Dragonfly
Candle shape with zeolite turned upside down
- If it occurs in the high zone, it is a downtrend signal
- Emerging from a low is a strong bullish signal going forward.
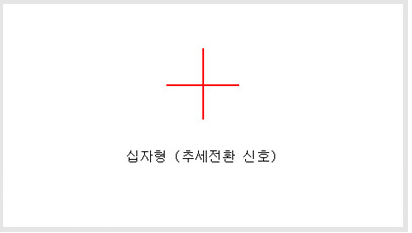
◆ Cross (trend reversal signal)
Cross candle shape
- Forward trend call signal with power balanced buys and sells
- If it occurs during an uptrend, there is a possibility that it will return to a downtrend.
- If it occurs during a downtrend, there is a possibility that it will return to an uptrend.
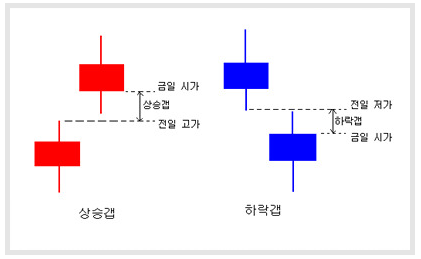
◆ Gap
Rising Gap: When the current price is higher than the previous day's high*
Down Gap: When today's market price is lower than yesterday's low*
- When a gap appears, it is interpreted as a temporary good or bad news, and it is heavily concentrated on one side of buying or selling.
- The uptrend gap is interpreted as a very strong buying trend.
- The bearish gap is interpreted as a very strong sell-off
The gap shape does not exist in the 24-hour Bitcoin chart.※
cf. Candle-shaped pattern application [Link]
| 언어를 감지갈리시아어구자라트어그루지야어그리스어네덜란드어네팔어노르웨이어덴마크어독일어라오어라트비아어라틴어러시아어루마니아어리투아니아어마라티어마오리어마케도니아어말레이어말라가시어말라얄람어몰타어몽골어몽어바스크어버마어베트남어벨로루시어벵골의보스니아어불가리아어세르비아어세부아노세소토어소말리아어순다어스와힐리어스웨덴어스페인어슬로바키아어슬로베니아어신할라어아랍어아르메니아어아이슬란드어아이티프랑스말아일랜드어아제르바이잔어아프리칸스어알바니아어에스토니아어에스페란토말영어요루바어우르두어우즈베크어우크라이나어웨일즈어이그보어이디시어이탈리아어인도네시아어일본어자바어줄루어중국어(간체)중국어(번체)체와어체코어카자흐어카탈로니아어칸나다어칸나다어크로아티아어타갈로그어타밀어타직어태국어터키어텔루구어펀자브어페르시아어포르투갈어폴란드어프랑스어핀란드어하우사어한국어헝가리어히브리어힌디어 |
|
갈리시아어구자라트어그루지야어그리스어네덜란드어네팔어노르웨이어덴마크어독일어라오어라트비아어라틴어러시아어루마니아어리투아니아어마라티어마오리어마케도니아어말레이어말라가시어말라얄람어몰타어몽골어몽어바스크어버마어베트남어벨로루시어벵골의보스니아어불가리아어세르비아어세부아노세소토어소말리아어순다어스와힐리어스웨덴어스페인어슬로바키아어슬로베니아어신할라어아랍어아르메니아어아이슬란드어아이티프랑스말아일랜드어아제르바이잔어아프리칸스어알바니아어에스토니아어에스페란토말영어요루바어우르두어우즈베크어우크라이나어웨일즈어이그보어이디시어이탈리아어인도네시아어일본어자바어줄루어중국어(간체)중국어(번체)체와어체코어카자흐어카탈로니아어칸나다어칸나다어크로아티아어타갈로그어타밀어타직어태국어터키어텔루구어펀자브어페르시아어포르투갈어폴란드어프랑스어핀란드어하우사어한국어헝가리어히브리어힌디어 |
|
|
|
|
|
|
2021년 해외코인거래소 순위 및 추천 |
|||
|
|
|
|
|
|
거래량 |
11조(1위) |
3.5조 |
9.5조 |
|
레버리지 |
최대100배 |
최대100배 |
최대125배 |
|
수수료 |
- 지정가 : 0.02% - 시장가 : 0.04%(1위) |
- 지정가 : -0.025% - 시장가 : 0.075% |
- 지정가 : -0.025% - 시장가 : 0.075% |
|
거래방법 |
현물+선물+마진 |
선물+주식+FOREX |
선물 |
|
회원가입
|
|||
|
할인코드
|
|||


