

9. What is a Stochastic Oscillator?
The Stochastic Oscillator is an indicator that measures the strength between the highest and lowest price in a specified period.
◆ What is Stochastic?
1. This indicator was developed by William Dunnigun in the 1950s and is an indicator that numerically shows overbought & oversold.
2. It visualizes using numbers from 0 to 100.
3. Its sensitivity can be adjusted by modifying a) specified period b) moving average condition value.
◆ What Stochastic represents
1. Overbought % Oversold numerically displayed as a number from 0 to 100. If it is over 80, it is usually considered overbought, and if it is less than 20, it is usually considered oversold.
2. However, since the indicator does not detect a reverse trend, it should be used only at the level of inferring future price movements.
3. The indicator has two lines.
Line 1) K% = Stochastic N (Overbought & Oversold in the specified period)
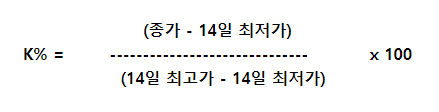
N of the highest/lowest price of N days is a variable.
Line 2) D% = Moving average of Stochastic N
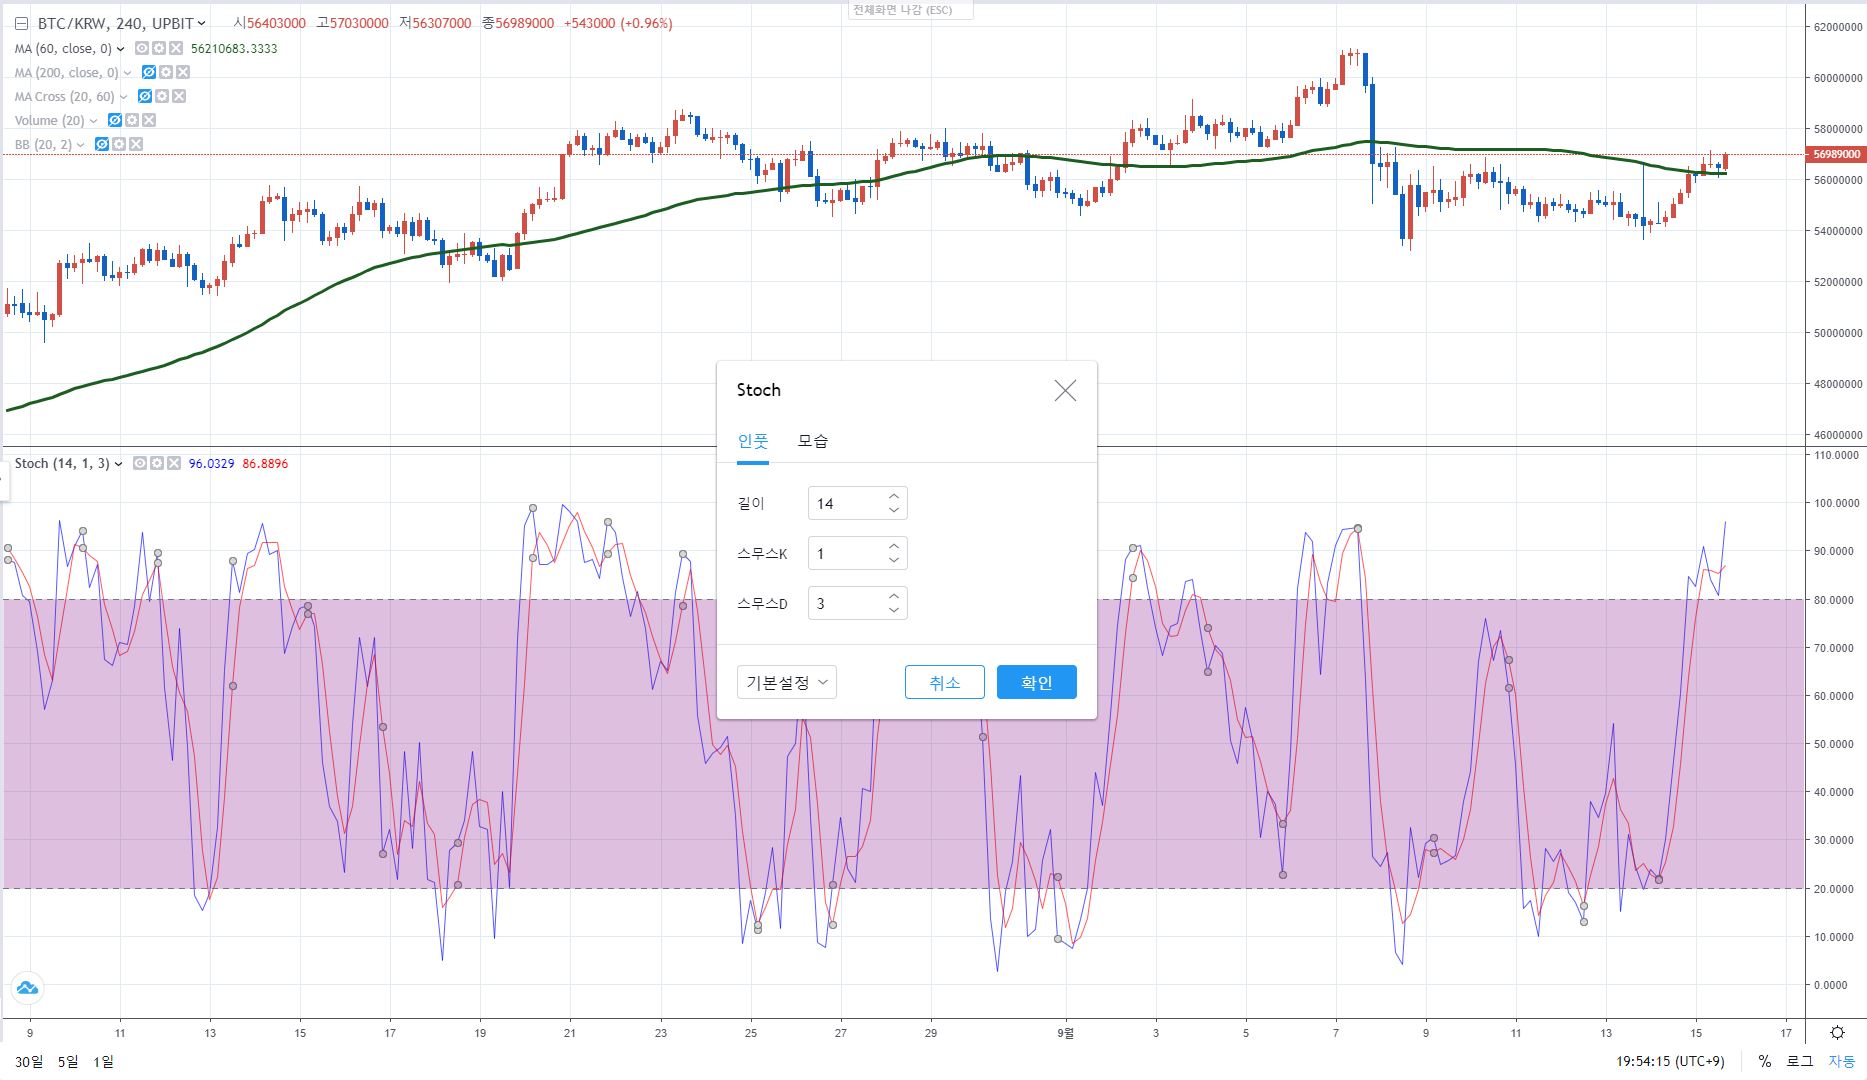
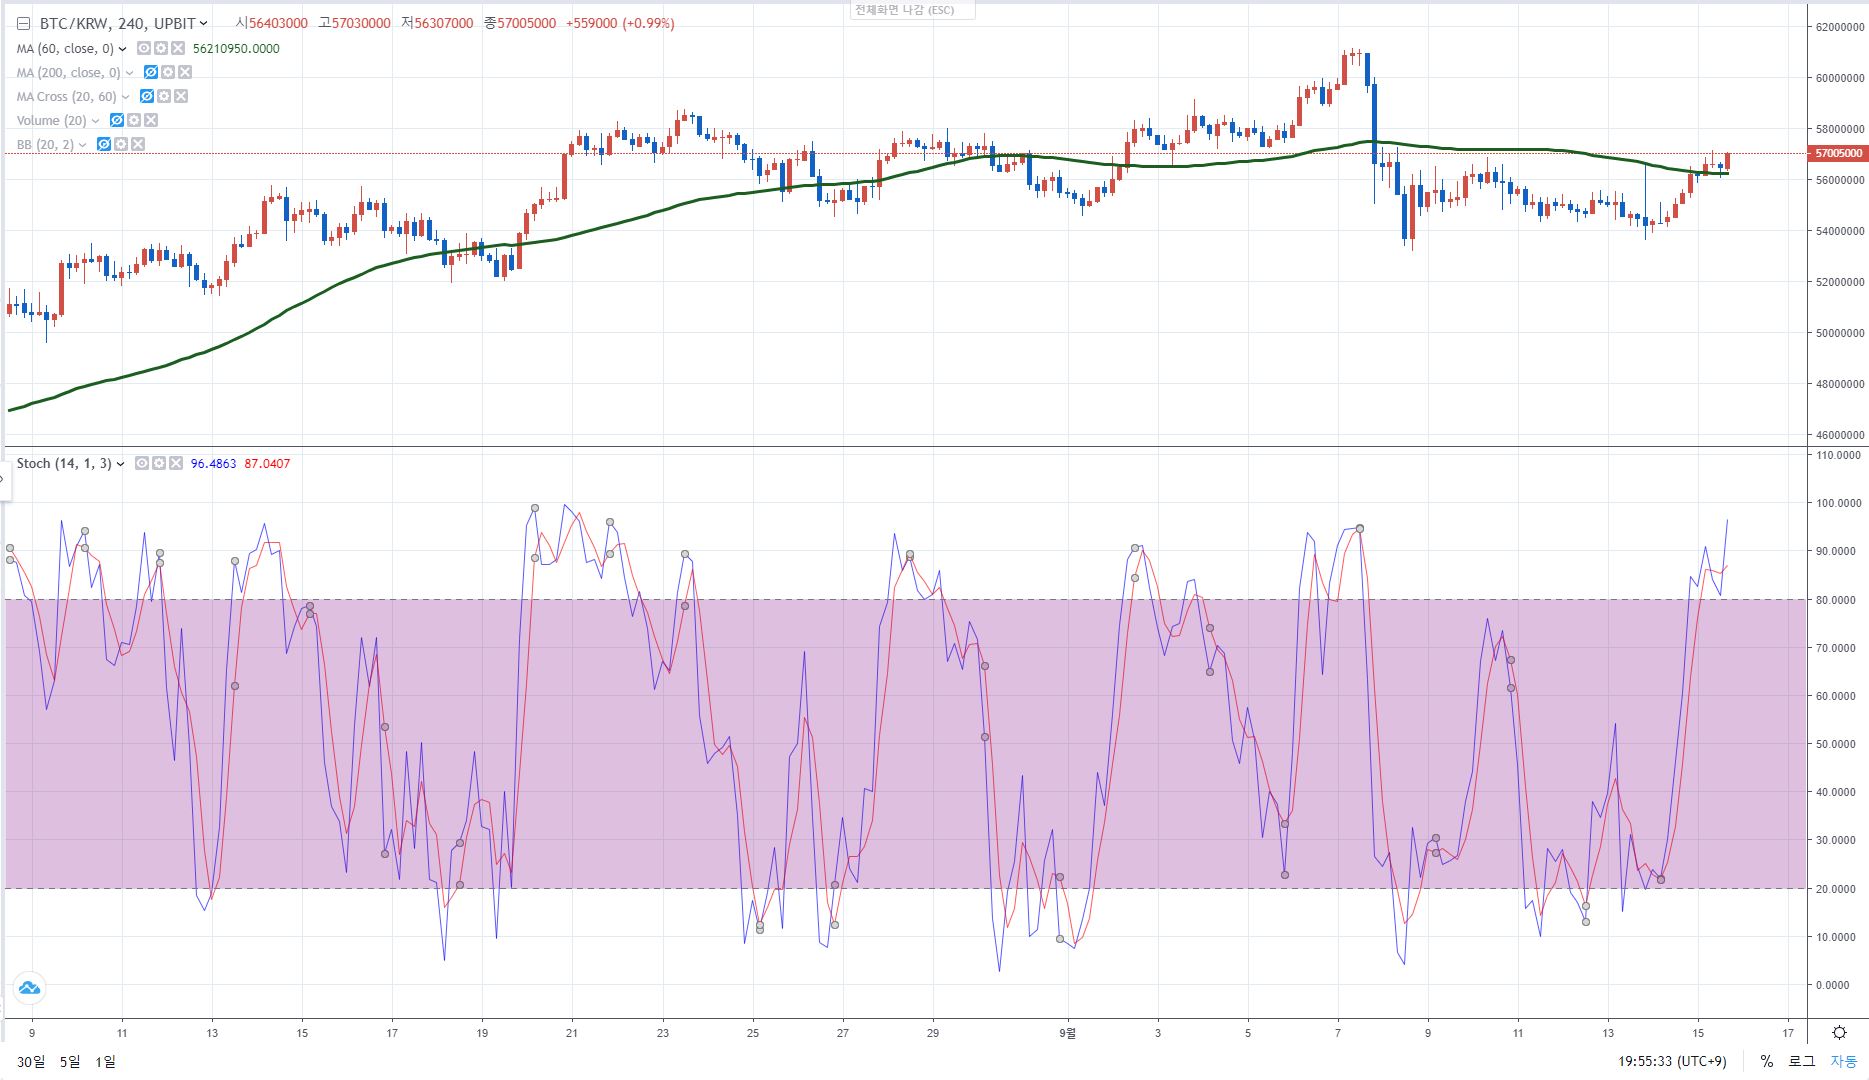
-Using only K% and D% is called fast stochastic.
-The graph obtained as above has frequent changes and a lot of noise, so instead of just using %K and %D, make a graph with the values obtained from each T-day moving average line.
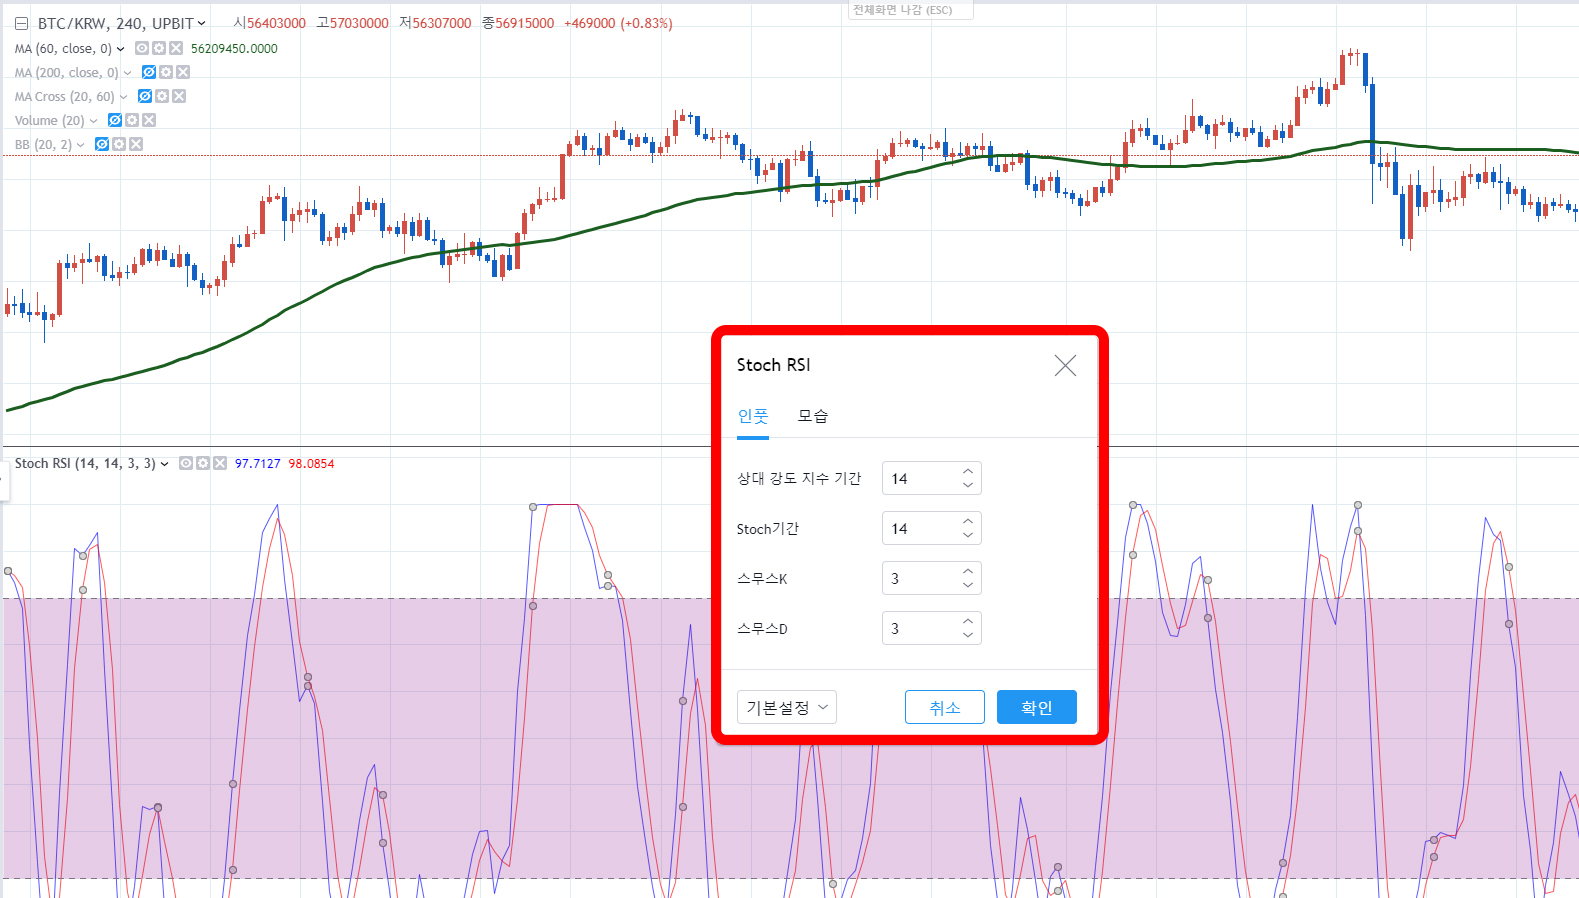
The default indicator settings for Upbit are (Length 14, Smooth K1, Smooth D3).
◆ What is the difference between RSI and Stochastic?
1. Both RSI and Stochastic are technical indicators of momentum based on the price of an asset class.
2. However, the logic behind these two is very different. Stochastic is based on the assumption that the recent closing prices of a given asset class will move in a trend/direction similar to the current price.
3. On the other hand, RSI displays oversold/overbought figures based on the “speed” of price movement.
4. Stochastic can be understood as Direction and RSI as Speed.
5. You can understand Stochastic as a sideways indicator and RSI as an indicator used in a market with a clear trend.
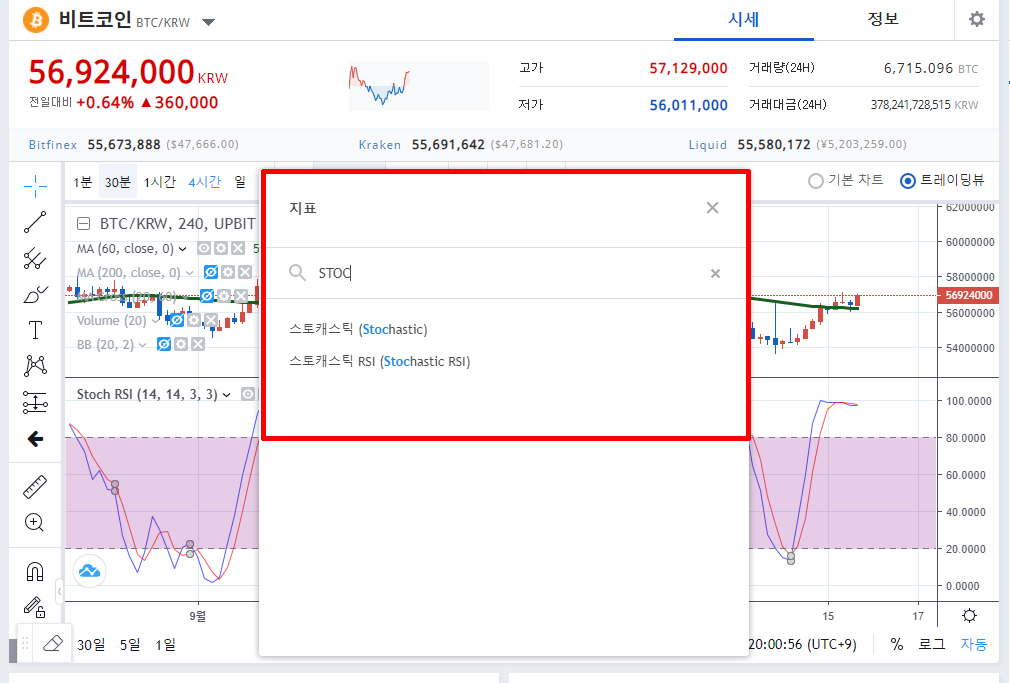
◆ There is also a Stochastic RSI indicator for your reference.
|
2021년 해외코인거래소 순위 및 추천 |
|||
|
|
|
|
|
|
거래량 |
11조(1위) |
3.5조 |
9.5조 |
|
레버리지 |
최대100배 |
최대100배 |
최대125배 |
|
수수료 |
- 지정가 : 0.02% - 시장가 : 0.04%(1위) |
- 지정가 : -0.025% - 시장가 : 0.075% |
- 지정가 : -0.025% - 시장가 : 0.075% |
|
거래방법 |
현물+선물+마진 |
선물+주식+FOREX |
선물 |
|
회원가입
|
|||
|
할인코드
|
|||


