
| 2021년 해외코인거래소 순위 및 추천 | |||
 |
 |
 |
|
| 거래량 | 11조(1위) | 1조 | 3.4조 |
|---|---|---|---|
| 레버리지 | 최대100배 | 최대100배 | 최대125배 |
| 수수료 | - 지정가 : 0.02% - 시장가 : 0.04%(1위) |
- 지정가 : -0.025% - 시장가 : 0.075% |
- 지정가 : -0.025% - 시장가 : 0.075% |
| 거래방법 | 현물+선물+마진 | 선물+주식+FOREX | 선물 |
| 회원가입 | 회원가입 | 회원가입 | 회원가입 |
| 할인코드 | 20% 할인 | 5% 할인 | 20% 할인 |
Trading View indicator recommendation
2019.06.09 05:41
Trading View indicator recommendation
Hello everyone
Today, I am going to show you how to recommend and discover a secondary indicator in Trading View. Be sure to watch it till the end!!
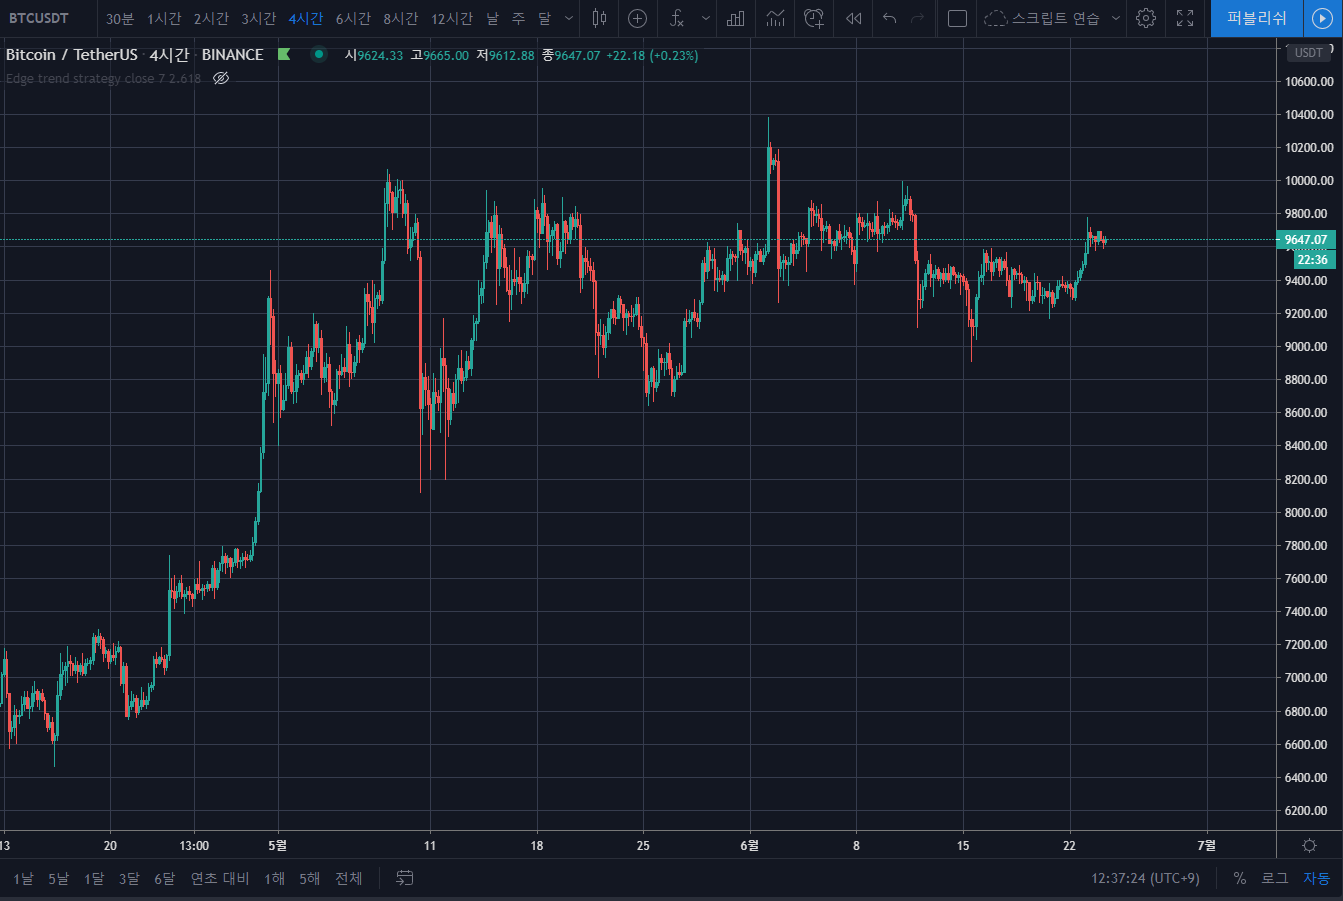
First of all, please run the trading view chart.
![]()
If you look closely, you can see the icon with "Fx" written on it? Please click this!
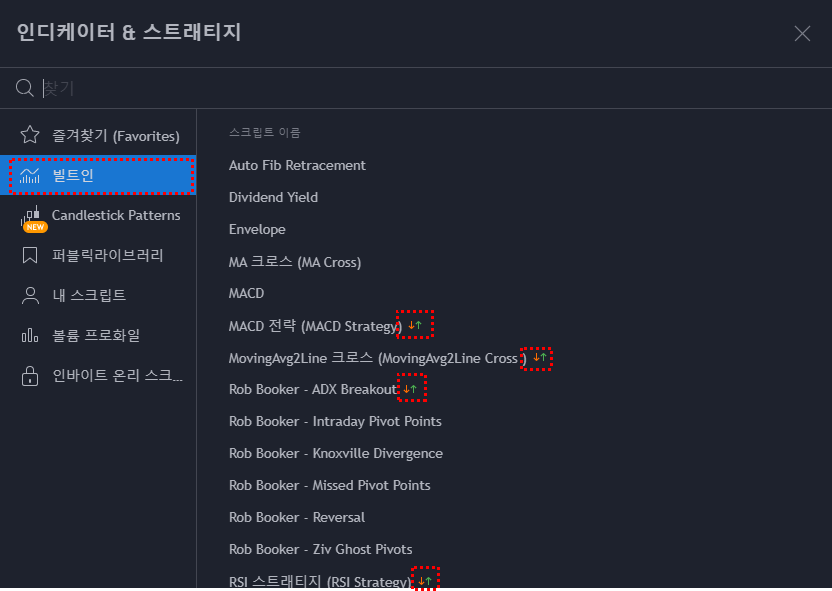
Then, indicators and strategies will appear, click "Built-in" here.
These are open source strategies created and shared by Trading View in advance with Pine Script, a programming language dedicated to Trading View.
If you look closely, you can see the arrow shape. This is an indicator that can be backtested.
Backtesting is a way to show how profitable it would be if you used a strategy you made in advance and operated it using past data.
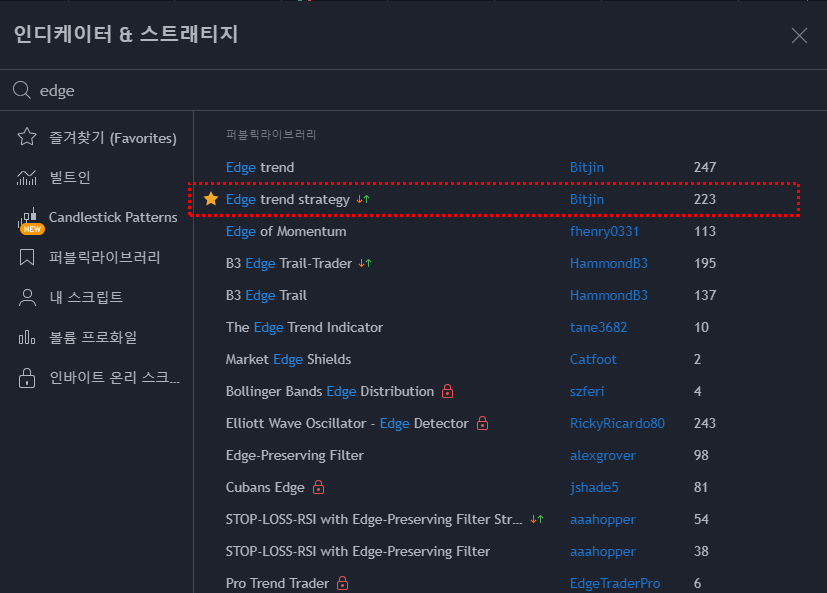
The indicator I recommend today is the Edge trend strategy.
It's located in the "public library", not the "built-in".
As you can see, it has an arrow shape, which means backtesting is possible.
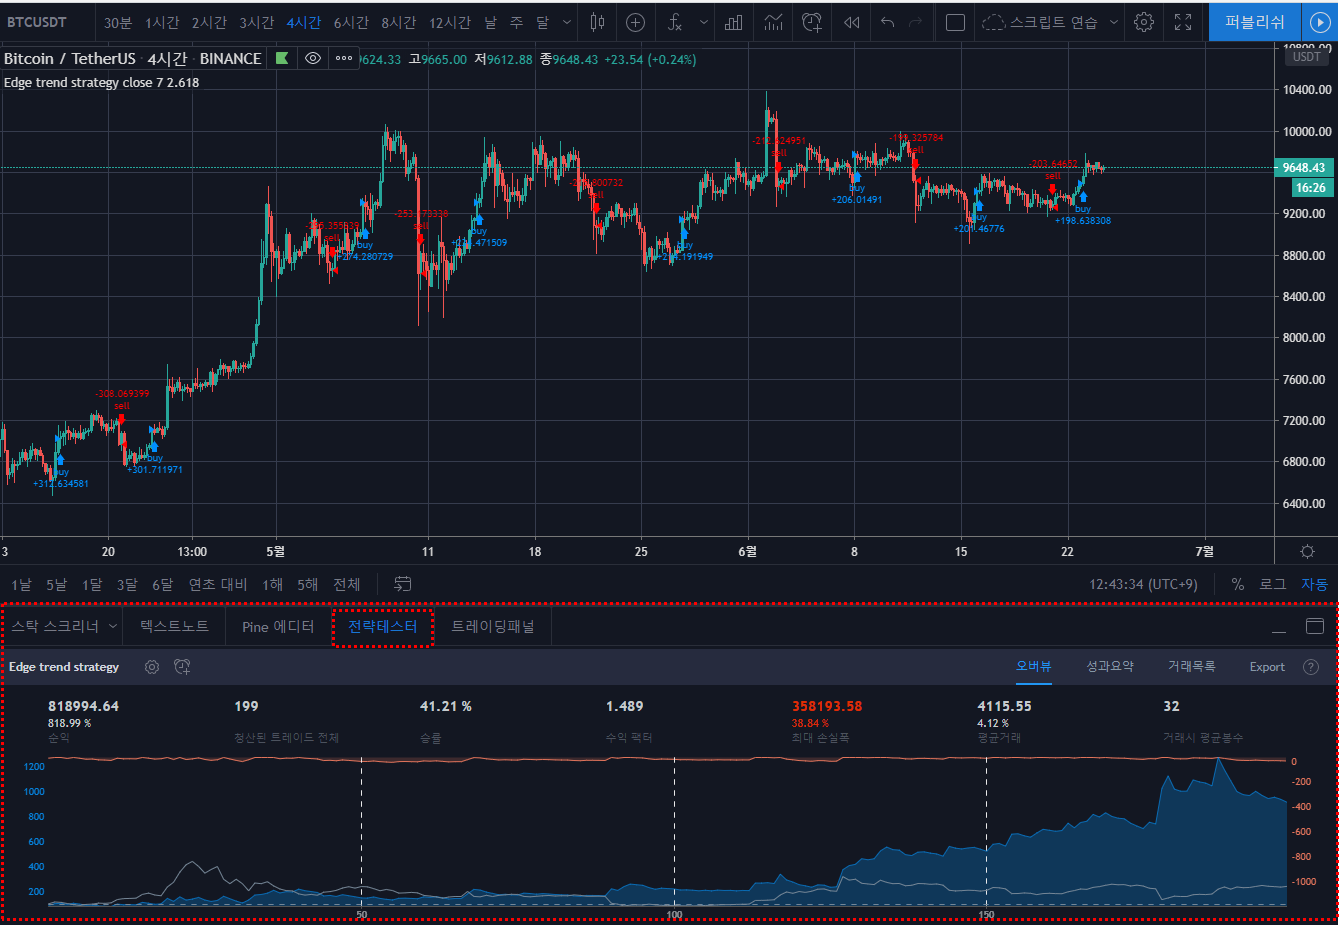
If you click the above strategy, it tells the result of running the simulation of the past data on the strategy tester as shown in the picture above ^^
It shows the figures such as profit/loss / total trades cleared / win rate / profit factor / maximum loss / average transaction / average number of rods in a transaction.
This indicator gives you a signal to buy or sell based on volatility called ATR, and is "free".
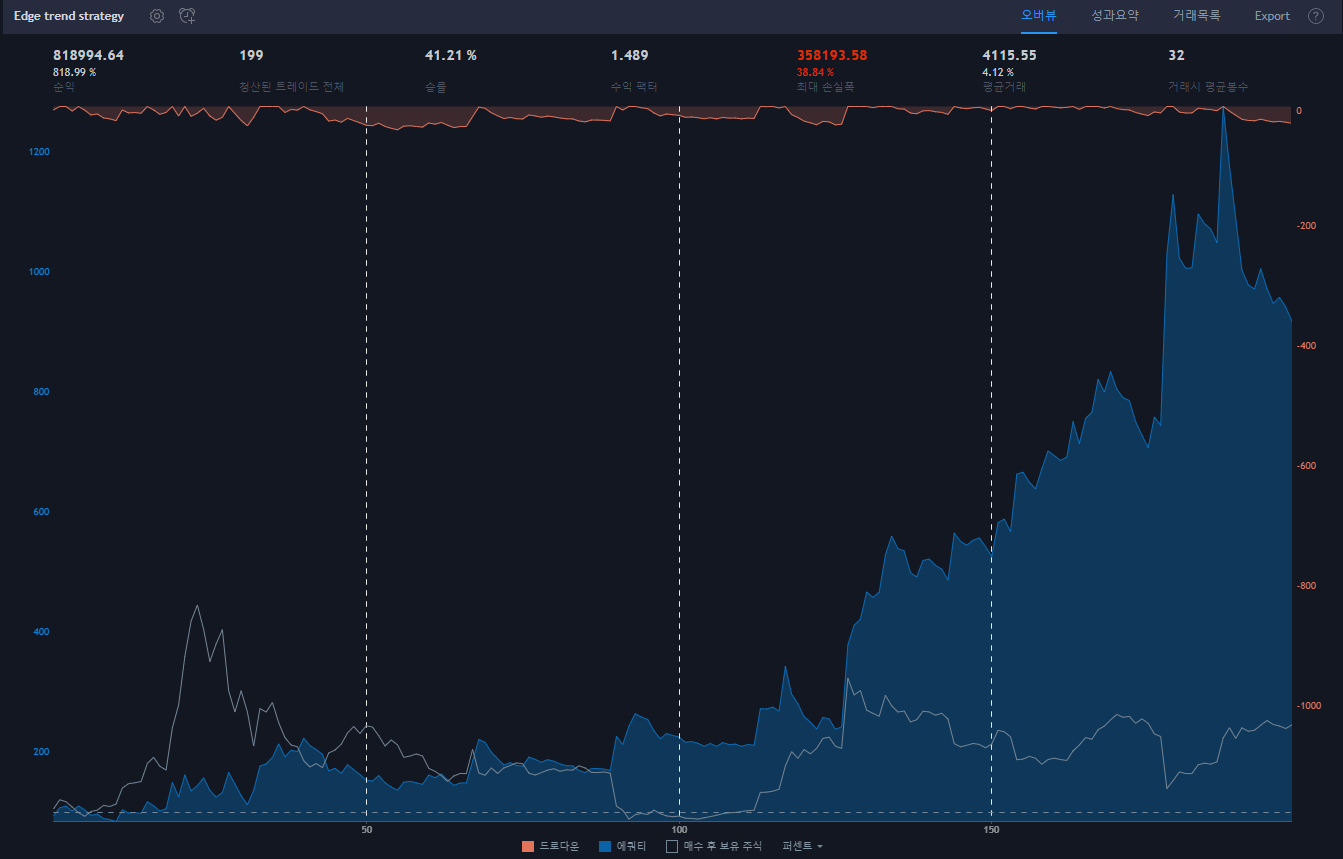
If you look a little bigger, you can see the past performance graph like the one above ^^
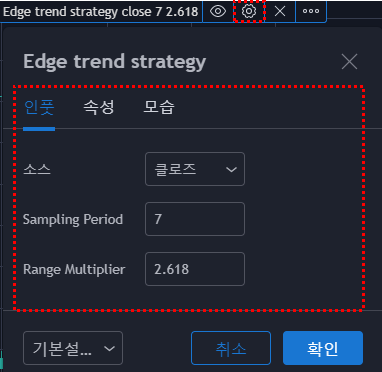
And if you click the gear icon of the indicator, the detailed usage of the indicator is displayed. You can see that the simulation result is changed by modifying the number here.
Also, the performance of this indicator changes even in the set time period. So, you can test different times and different numbers and use it when you think it's a good strategy for you.
Investing should be done by studying, researching, and proceeding on your own. There is no perfect strategy in the world. However, the strategy that suits you well and each individual's inclination are different ^^
Summary :
1. Click "Fx" in the Trading View Chart.
2. Then click "Built-in".
3, then study the indicators with arrows one by one and find the indicators that are right for you through a back test.
4. After research and study, invest a small amount in practice and compare it with simulation.
5. Upon verification, the investment is increased.
Then, we will finish recommending the above indicators for TradingView!
