
| 2021년 해외코인거래소 순위 및 추천 | |||
 |
 |
 |
|
| 거래량 | 11조(1위) | 1조 | 3.4조 |
|---|---|---|---|
| 레버리지 | 최대100배 | 최대100배 | 최대125배 |
| 수수료 | - 지정가 : 0.02% - 시장가 : 0.04%(1위) |
- 지정가 : -0.025% - 시장가 : 0.075% |
- 지정가 : -0.025% - 시장가 : 0.075% |
| 거래방법 | 현물+선물+마진 | 선물+주식+FOREX | 선물 |
| 회원가입 | 회원가입 | 회원가입 | 회원가입 |
| 할인코드 | 20% 할인 | 5% 할인 | 20% 할인 |
How to view trading view bitcoin dominance (share)
2020.11.10 00:51
Bitcoin is one of the leaders of the cryptocurrency market, and has been firmly holding the No. 1 position since its birth in 2009. Governments around the world, which initially viewed only as speculative factors, are one after another passing legal laws and taxing them. In addition, funds from numerous financial companies, including top-tier hedge funds (Renaissance Technology), are involved in inflows.
There are several ways to utilize the Dominance (share) indicator.
Portfolio Investors:
- Diversification by adding to the portfolio for hedging purposes as the correlation with traditional asset classes is low.
- I also want to hold several types of coins, but I can refer to the share.
- Example: You are going to buy the top 10 coins, but how to calculate the share of each coin and buy it by weight.
Traders:
- We are aiming for market profit by taking advantage of volatility. It is still difficult to see the market as an efficient market because of the large proportion of individuals, and it is difficult to make an accurate value judgment.
-From a trading point of view, a coin with a high market share will have good trading volume and solid fundamentals.
-From another point of view, since it has the highest market share, it is possible to trade altcoins that are slightly lighter due to their high market cap.
Now, let’s see how to view Bitcoin Dominance (share) in TradingView.
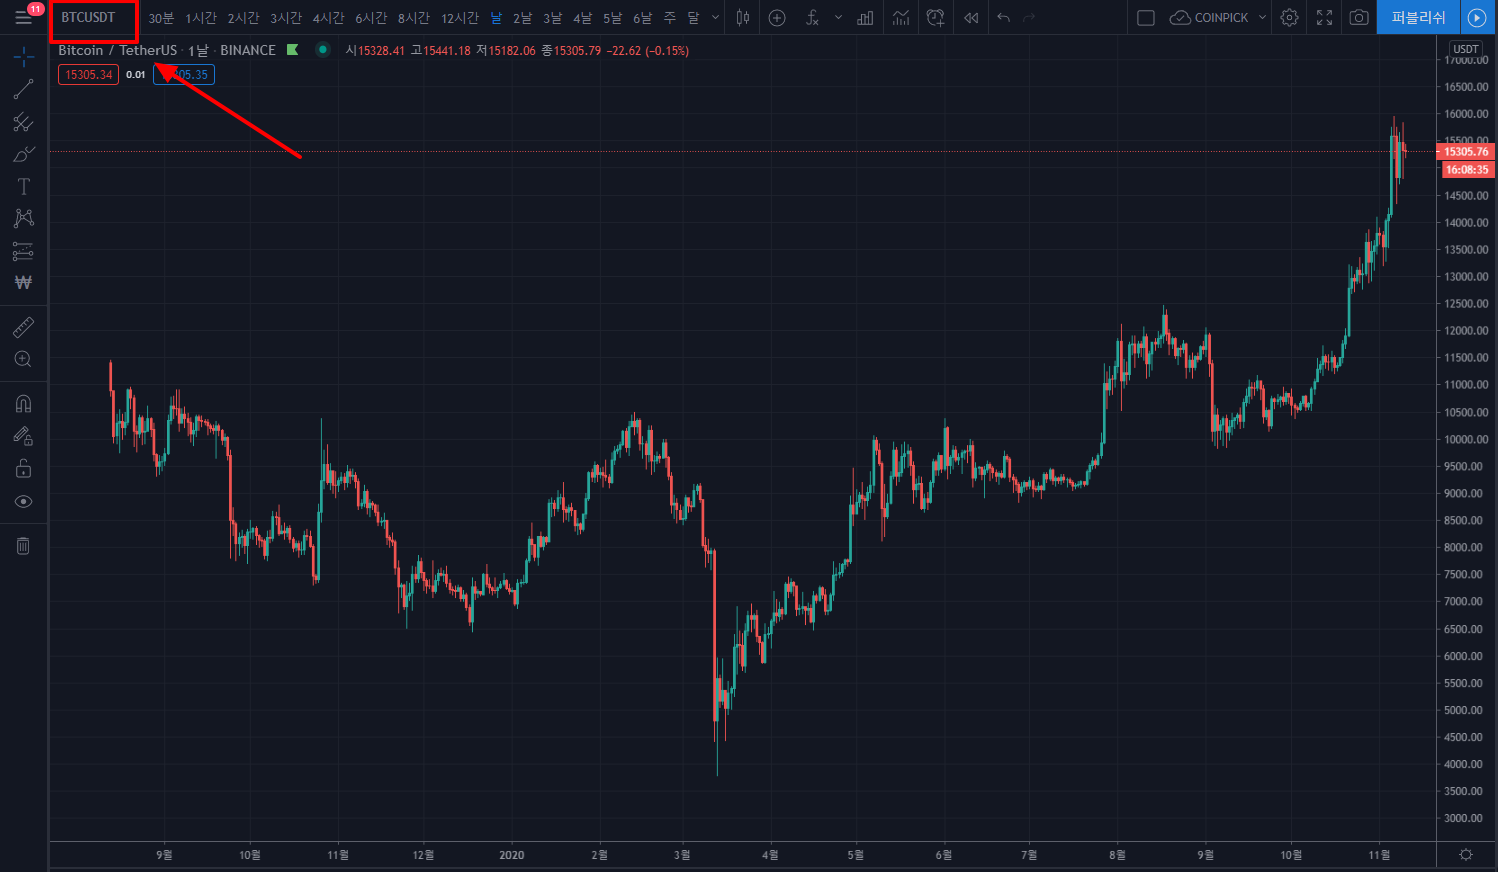
1. Currently, the Bitcoin price chart has been uploaded. You click on the window to search for an asset class in the upper left corner.
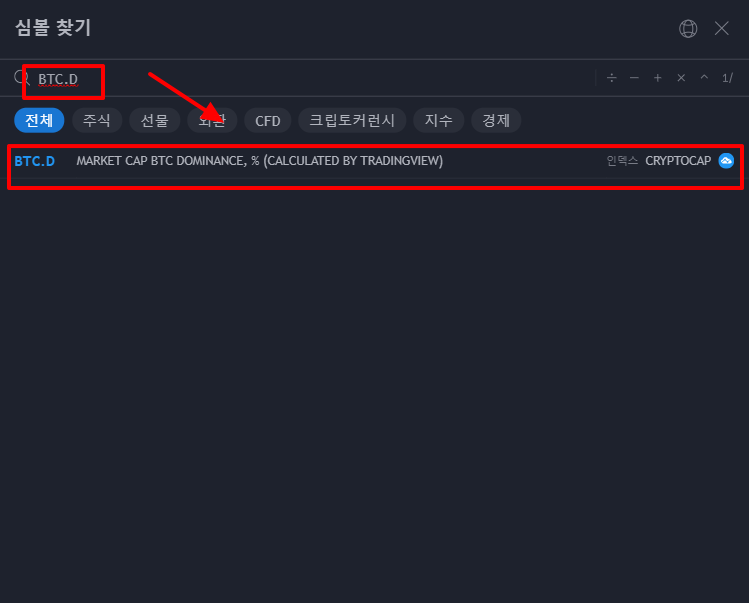
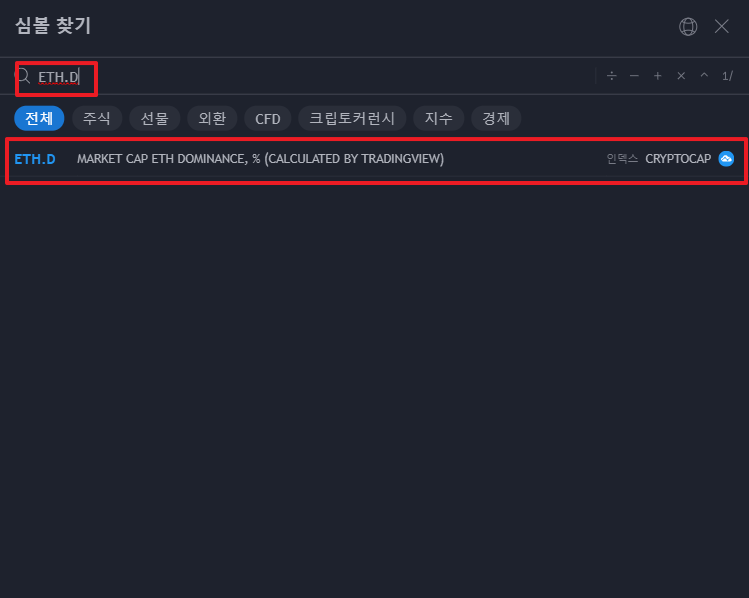
2. Search "BTC.D" -> Bitcoin Dominance in the symbol search to find the index. Click this to apply it to the chart. This is not an indicator, but an index of the share itself, so the existing chart is replaced.
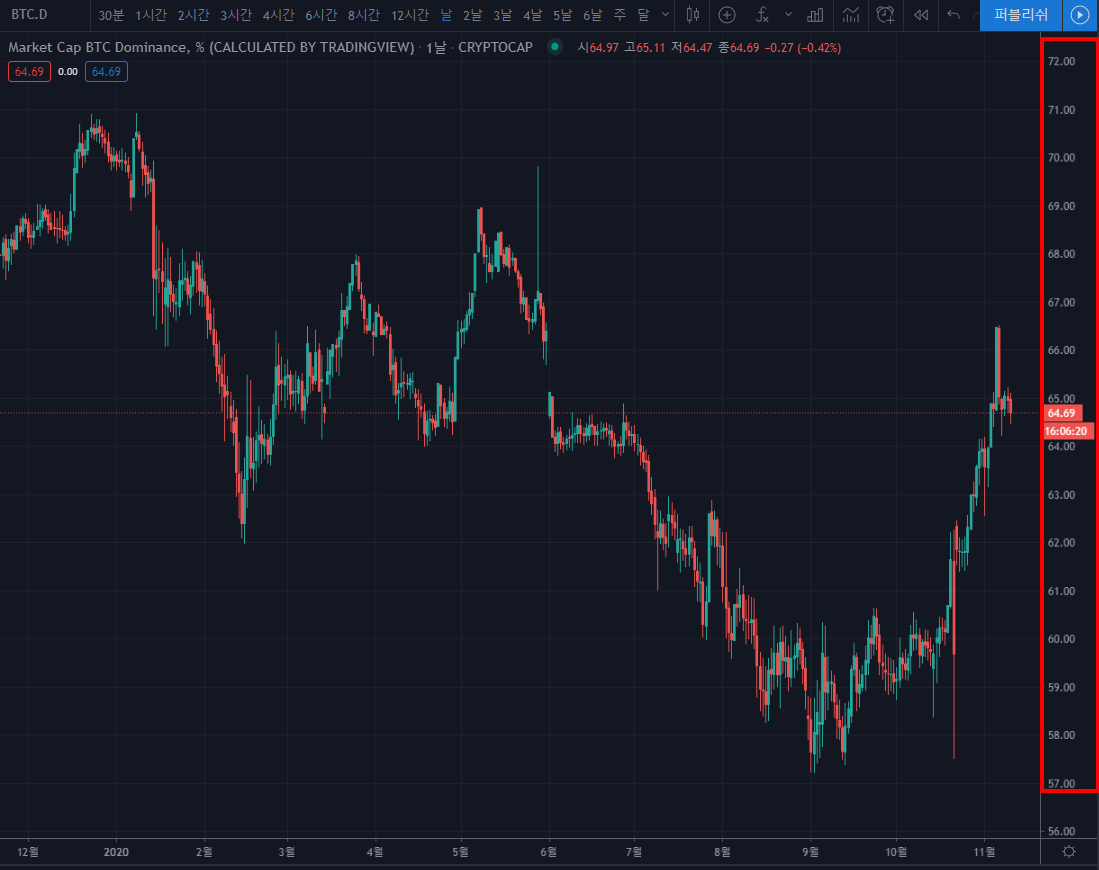
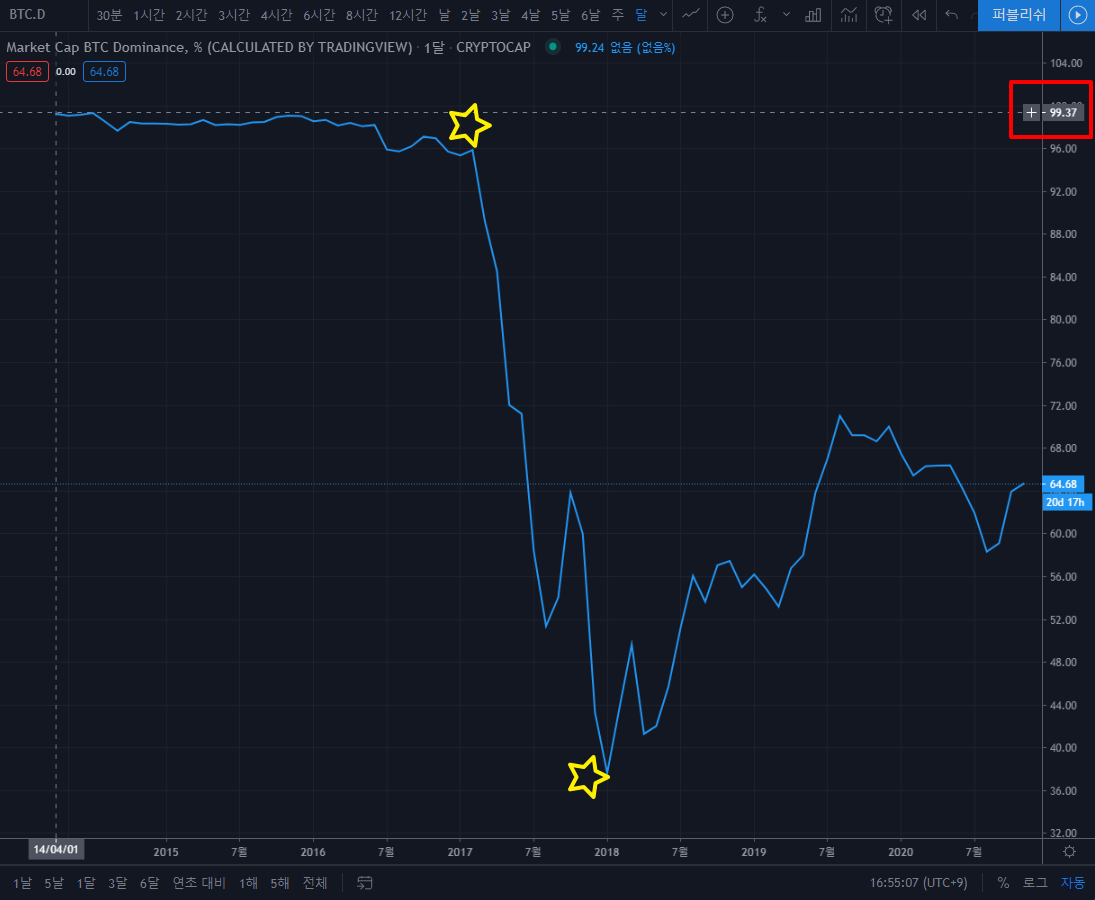
3. Wala! It was applied as follows. The number on the right stands for %. Bitcoin's share is now about 65%.
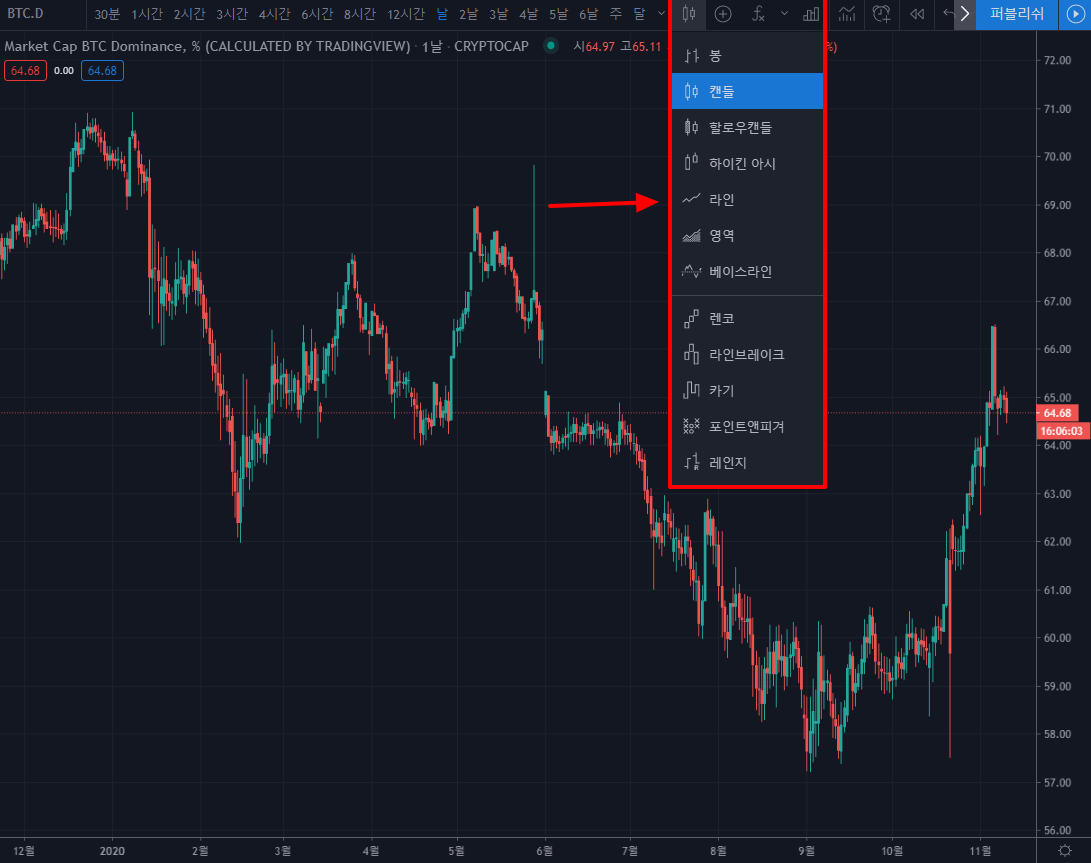
4. Line charts can be viewed more smoothly than candle charts. If you click the candle-shaped icon at the top, several types of charts are supported, such as rods, candles, hollows, Heikin-Ashi, Lines, Young Eoks, and Baselines, as shown below, so you can choose the one that suits your preference.
5. After changing to a line chart, I modified the timeframe to monthly. What the data says is
-On January 01, 2014, the share of Bitcoin was 99%.
In 2017-2018, the share fell from 95% to 35%.
- This is the period when Bitcoin falls and Ethereum rises.
-Beat's share has risen to 65% again.
This way you can judge the overall situation and help you invest!
Extra: You can also search for Ethereum Dominance!
You can also observe the chart as a multi-chart like this~! You can do it in any way that is convenient for you ^^
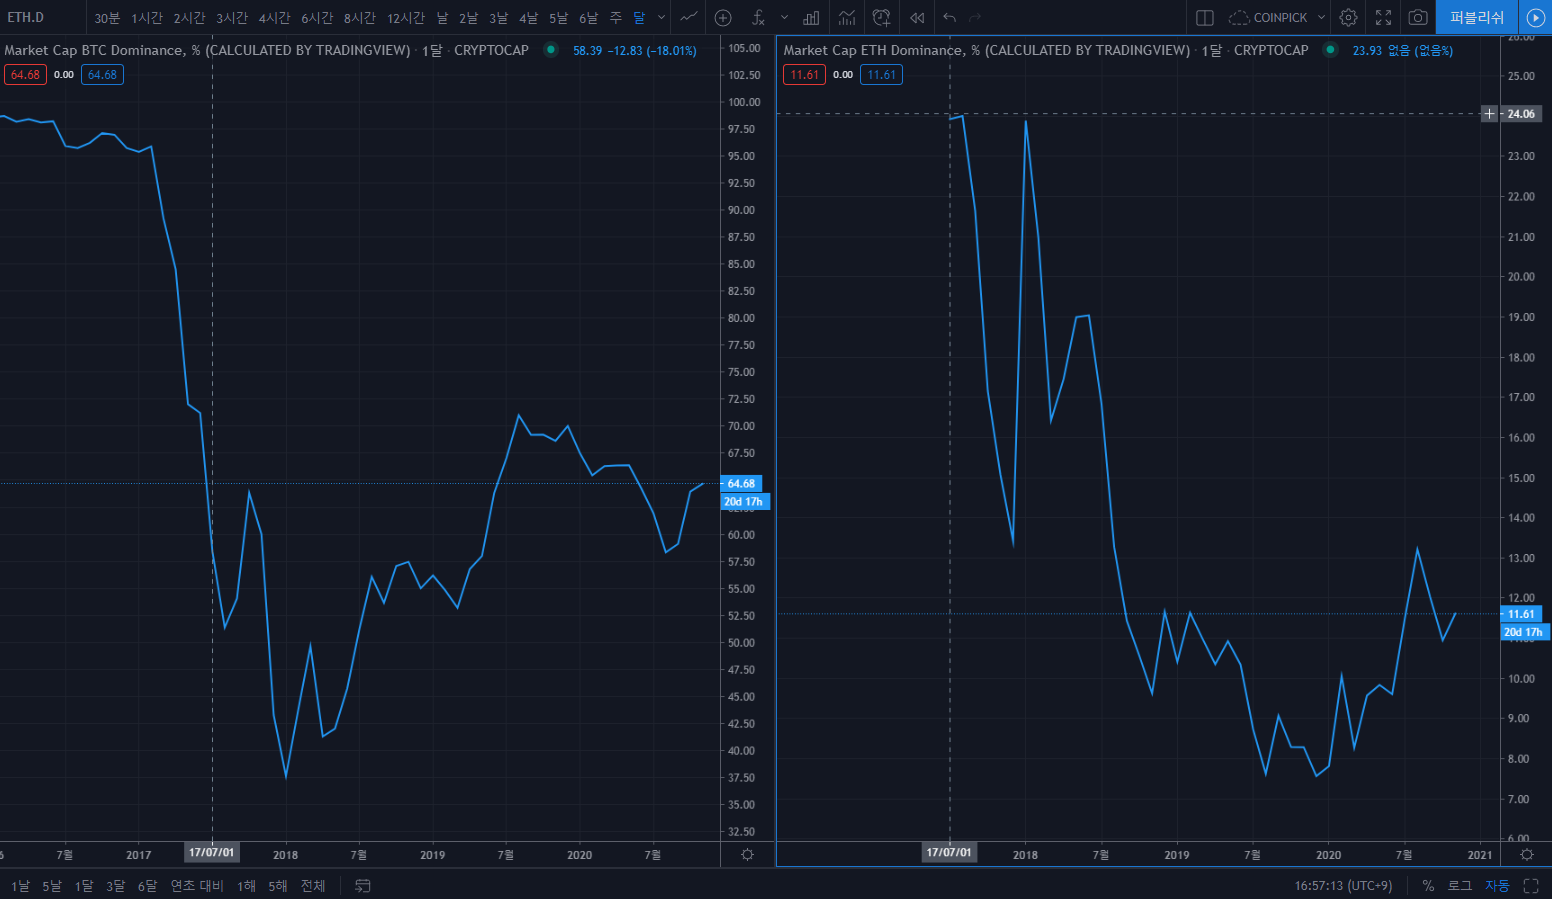
that's it~ everyone cheer up!!

댓글 0
| 번호 | 제목 | 날짜 | 조회 수 | 글쓴이 |
|---|---|---|---|---|
| 3 | Where to look for bitcoin charts | 2021.02.22 | 833 | 제육볶음 |
| 2 |
Bitcoin chart analysis site
| 2021.02.22 | 1123 | 제육볶음 |
| » |
How to view trading view bitcoin dominance (share)
| 2020.11.10 | 4291 | 퀀트픽 |