| 2021년 해외코인거래소 순위 및 추천 | |||
 |
 |
 |
|
| 거래량 | 11조(1위) | 1조 | 3.4조 |
|---|---|---|---|
| 레버리지 | 최대100배 | 최대100배 | 최대125배 |
| 수수료 | - 지정가 : 0.02% - 시장가 : 0.04%(1위) |
- 지정가 : -0.025% - 시장가 : 0.075% |
- 지정가 : -0.025% - 시장가 : 0.075% |
| 거래방법 | 현물+선물+마진 | 선물+주식+FOREX | 선물 |
| 회원가입 | 회원가입 | 회원가입 | 회원가입 |
| 할인코드 | 20% 할인 | 5% 할인 | 20% 할인 |
how to overlap TradingView indicators
2020.11.08 23:41
Even If you google how to overlap TradingView indicators, it wouldn’t come up well.
If you found this article, you have made a move.
In this time, I will show you how to overlay indicators, not charts, on one chart in Trading View.
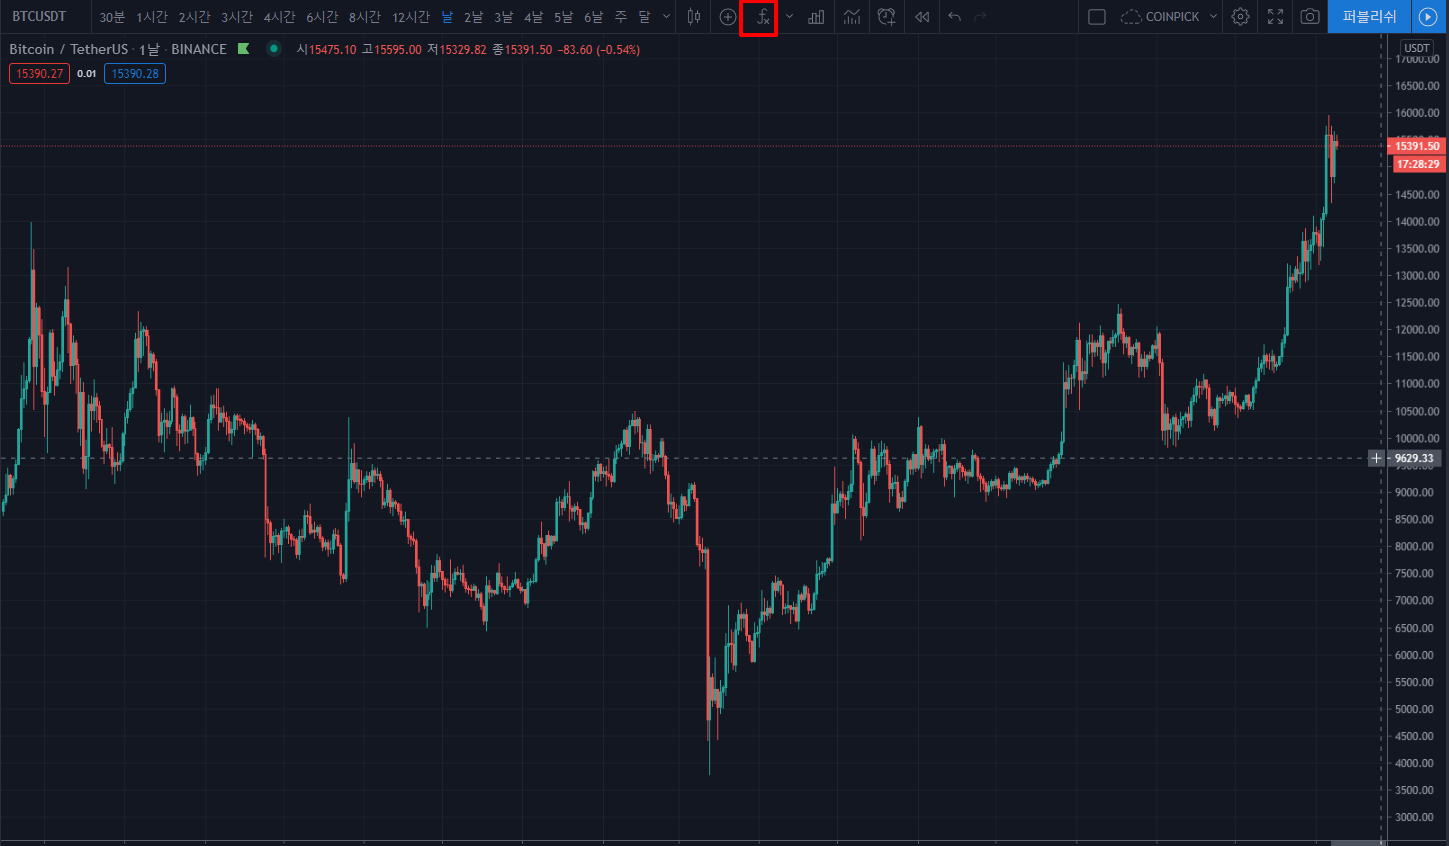
1. First of all, put the asset class you want to trade on the chart. Then, click the "Fx" icon in the upper right corner or press "/" on the keyboard to bring up a pop-up window where you can select an indicator.
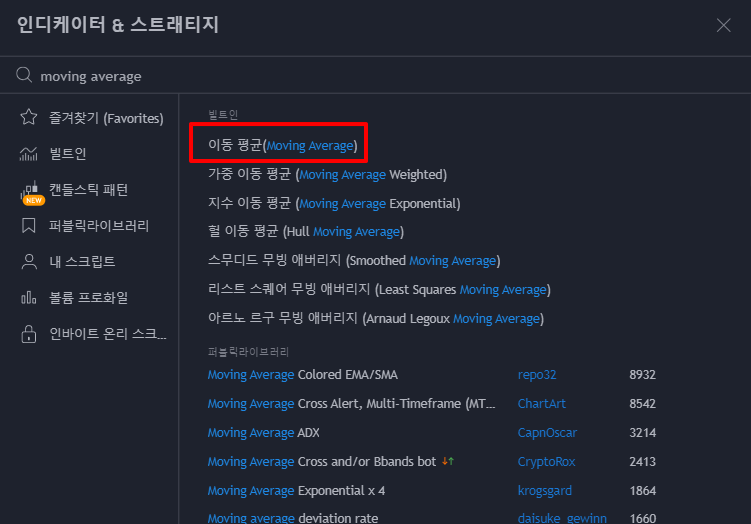
2. In this post, we will overlap the moving average with the MACD. If you search Moving Average in the indicator search bar, you will find a moving average line indicator created in advance in Trading View. Click on that indicator!
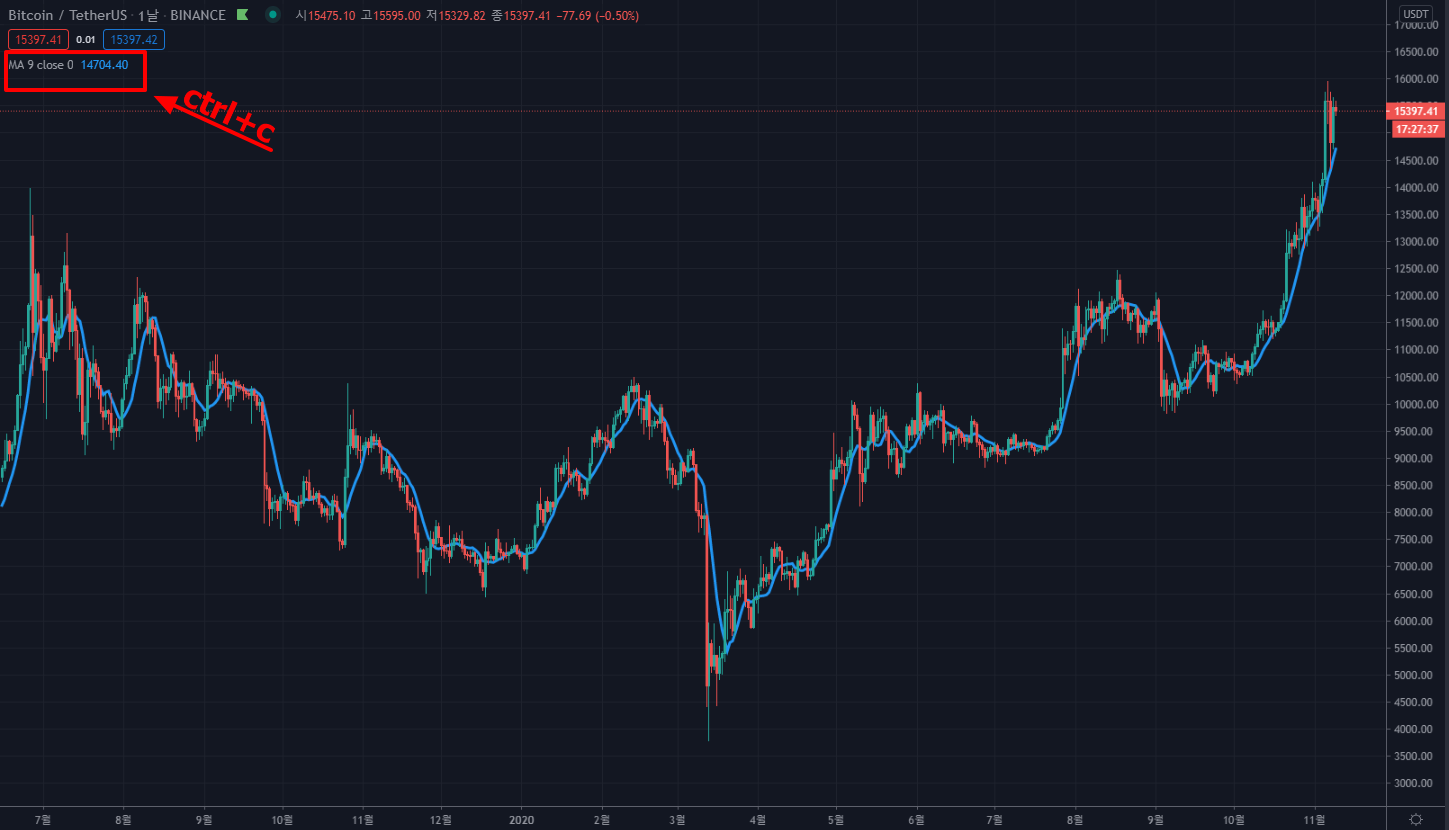
3. You can see that the moving average line is applied in the upper left corner. There is no need to search for indicators again to overlap with multiple moving averages. Click on the relevant indicator and copy and paste with CTRL + C & CTRL + V to create multiple indicators with the same condition value.
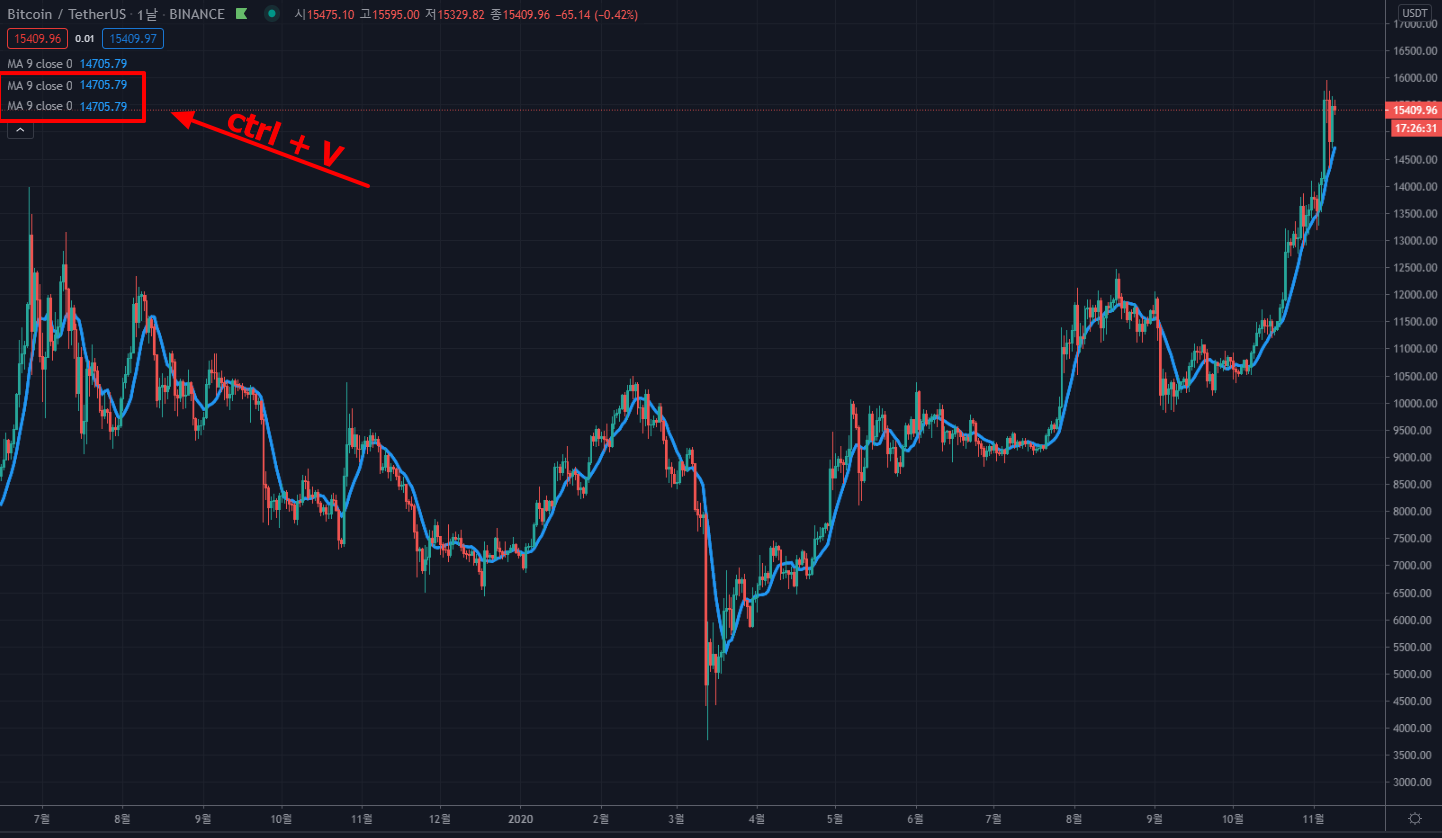
4. Three moving averages have been created. In the chart, it is shown as one line overlapping the same condition value. This time, I will change the setting value of each indicator and the color and thickness of the line to make it easier to check with the naked eye.
5. Click the "gear" icon for each indicator. You can set the setting values as follows. I will set it to 5 days / 10 days / 20 days, respectively, and change the color of the line.
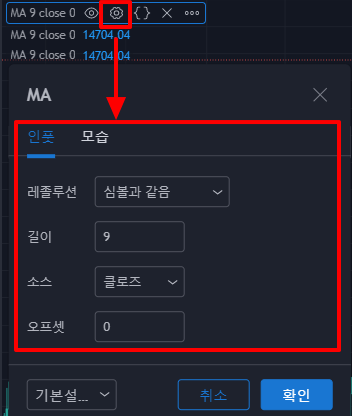
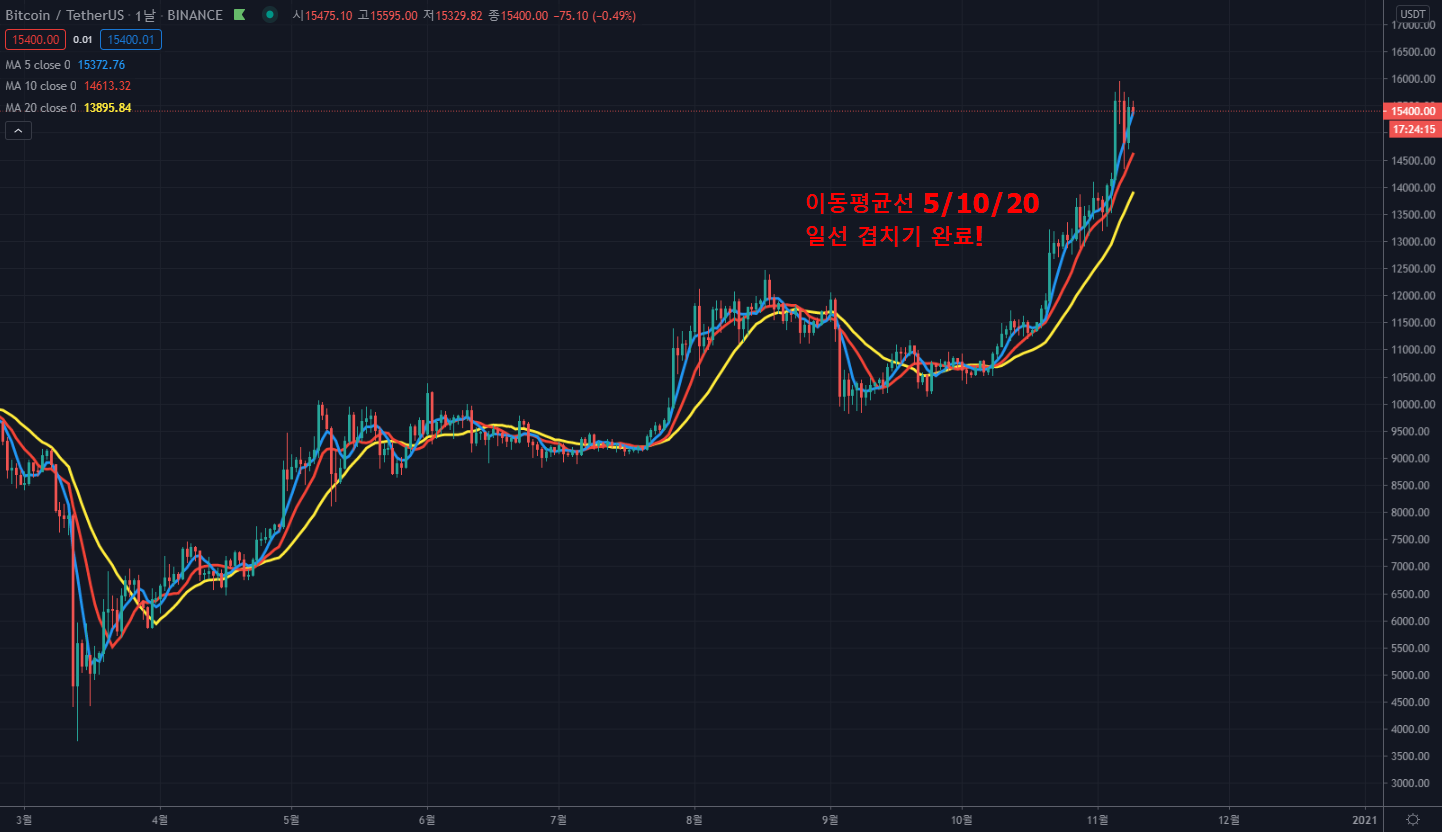
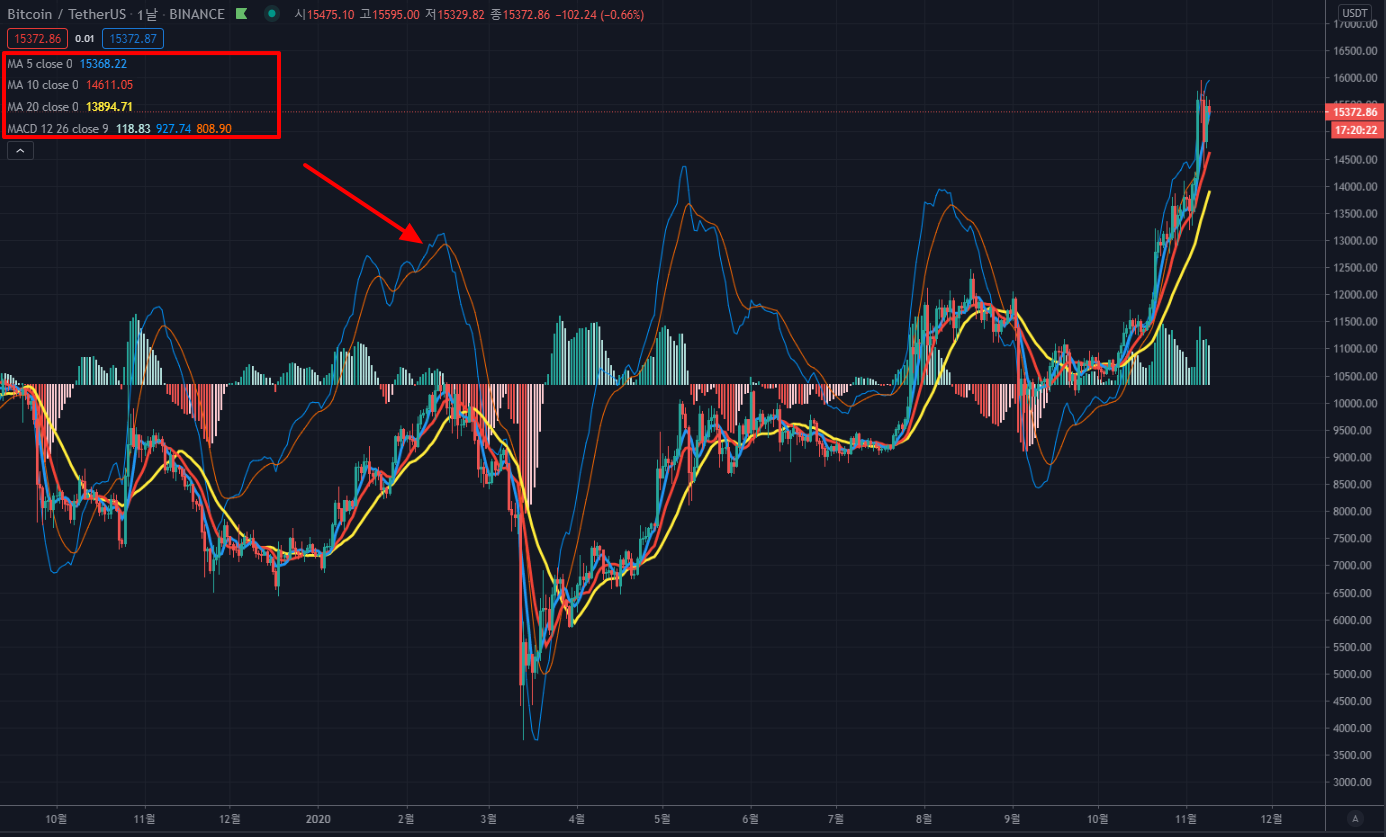
6. Wala! 3 moving averages overlapped as shown below!
Really easy isn't it? Next, let's superimpose the MACD.
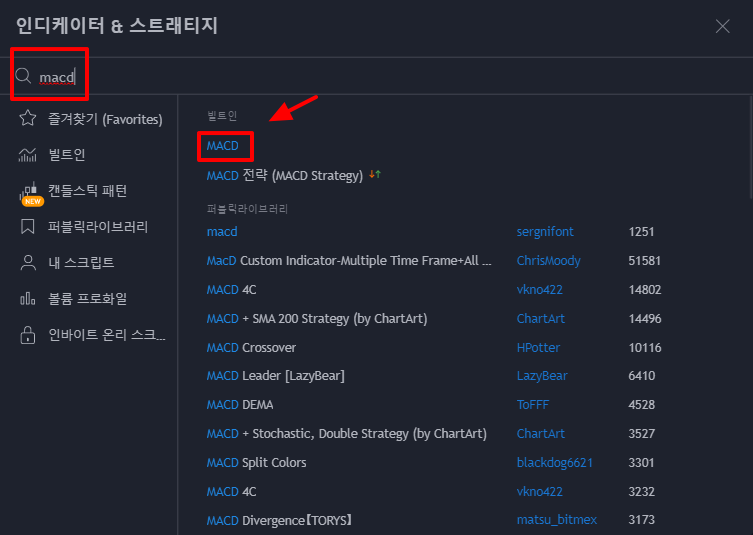
7. Press the "Fx" icon or "/" again to launch the indicator search window.
And when you search for MACD, click the indicator you made in advance in Trading View at the top.
8. MACD was created at the bottom of the candlestick chart with the moving average line applied. It's very easy to garnish with candle charts.
After creating MACD or any other indicator, click on the line (line) on the indicator, then drag and drop it onto the candle chart (click and release the mouse on the candle chart).
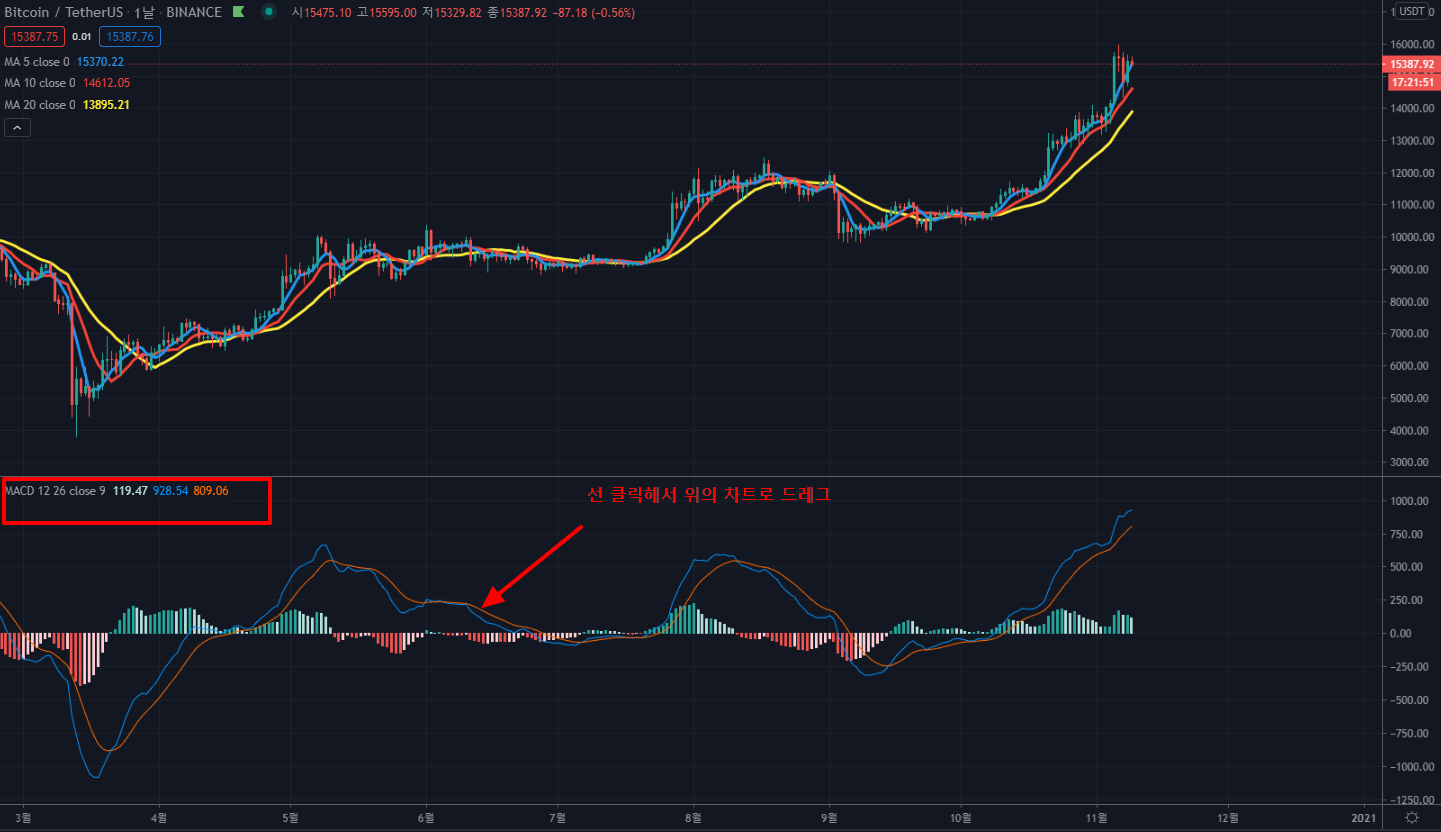
9. Wala! With the moving average of 5, 10, and 20 overlapping, MACD was additionally placed on the candle chart! Isn't it simple??
댓글 0
| 번호 | 제목 | 날짜 | 조회 수 | 글쓴이 |
|---|---|---|---|---|
| 10 |
How to use the TradingView mobile app!
| 2020.11.12 | 2430 | 퀀트픽 |
| 9 |
How to view trading view bitcoin dominance (share)
| 2020.11.10 | 4291 | 퀀트픽 |
| » |
how to overlap TradingView indicators
| 2020.11.08 | 2029 | 퀀트픽 |
| 7 |
How to take a trading view snapshot
| 2020.10.25 | 584 | 퀀트픽 |
| 6 |
How to check trading view repaint indicators
| 2020.10.25 | 469 | 퀀트픽 |
| 5 |
How to replay trading view charts
| 2020.10.25 | 1212 | 퀀트픽 |
| 4 |
How to set up TradingView Fibonacci Retracement
| 2020.10.11 | 4166 | 퀀트픽 |
| 3 |
How to extract trading view backtest data with Autoview
| 2020.10.11 | 338 | 퀀트픽 |
| 2 |
How to set up TradingView notifications (alerts)
| 2020.10.11 | 6187 | 퀀트픽 |
| 1 |
How to set trading view separation
| 2020.10.11 | 2560 | 퀀트픽 |

