

8. Fibonacci Retracement Method
What is Fibonacci Retracement?
It is an array of numbers created by Italian mathematician Fibonacci, which is a kind of golden ratio concept.
cf. Fibonacci Retracement [Related]
The Fibonacci retracement arrangement we usually see is
38.2% / 50% / 61.8%
You can remember about 3 of these
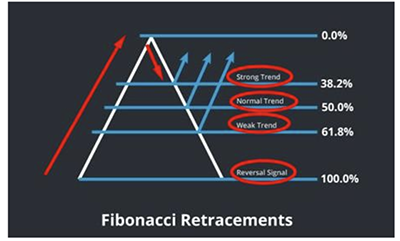
This Fibonacci retracement is used to predict a rebound or correction period.
If you look at the image above, if you see the lowest low of the candle as 0, the highest as 1, and plot this with the Fibonacci scale,
Rebound to 38.2% and correction at 38.2%
Fibonacci retracement trading method
Buying Timing: When the rebound starts
Selling Timing: When the correction begins
Easy, right?
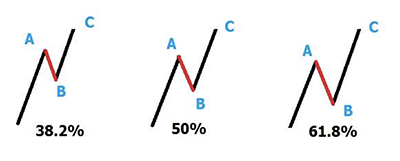
Look at the image below and think in your head to understand.
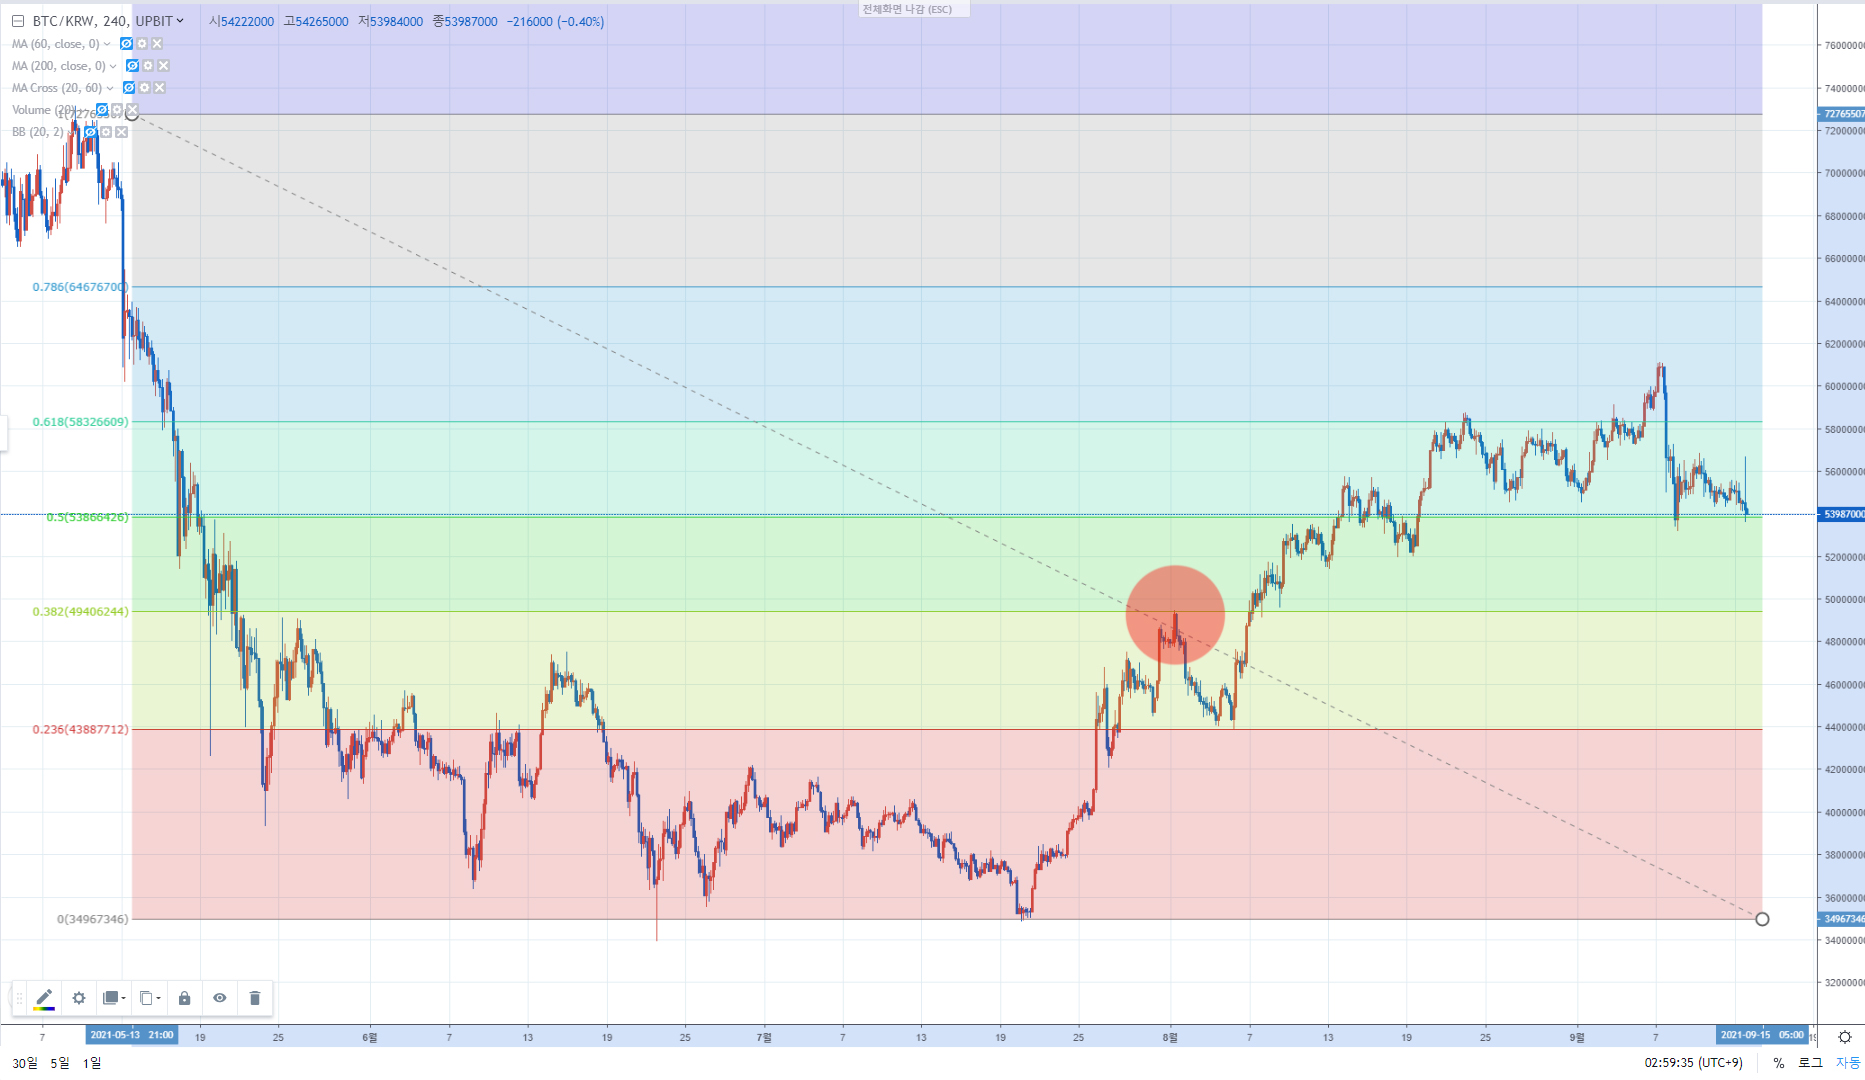
◆ Adjust after rebounding to 0.382 section
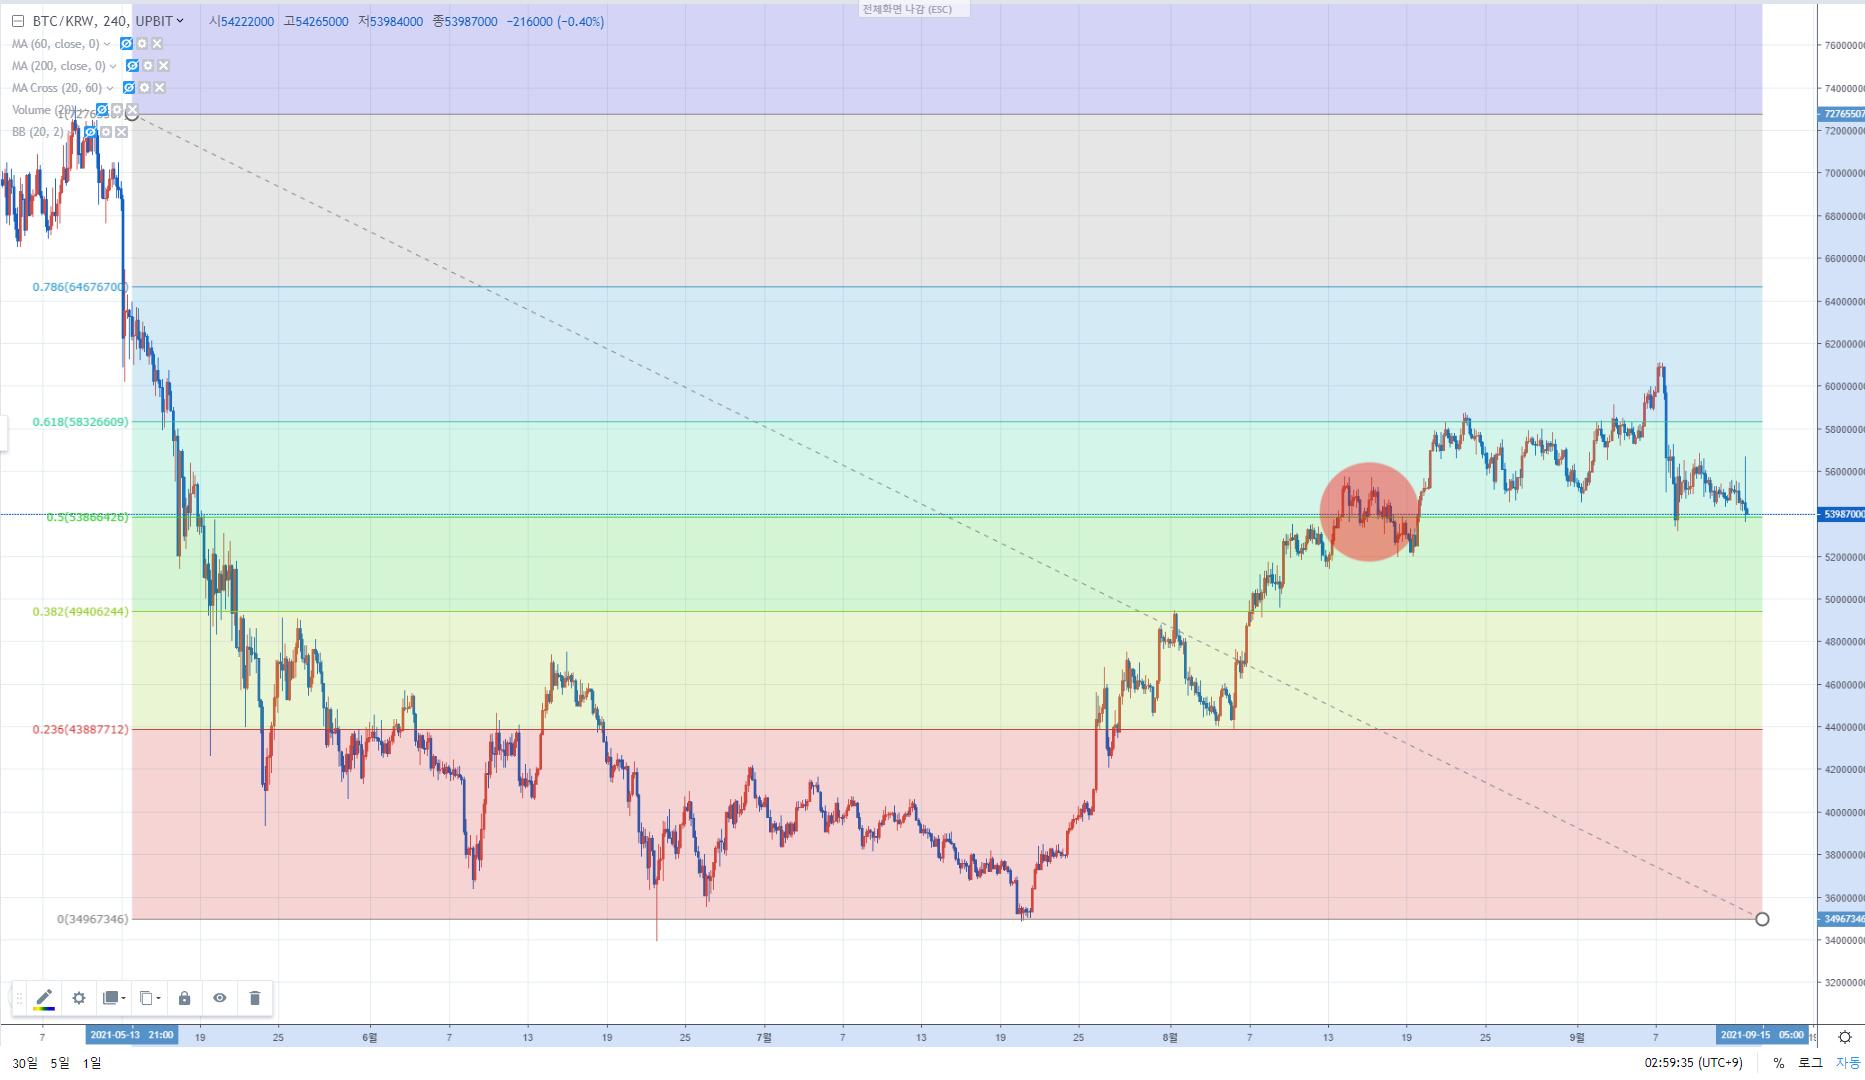
◆ After about 0.5 section, it rises again
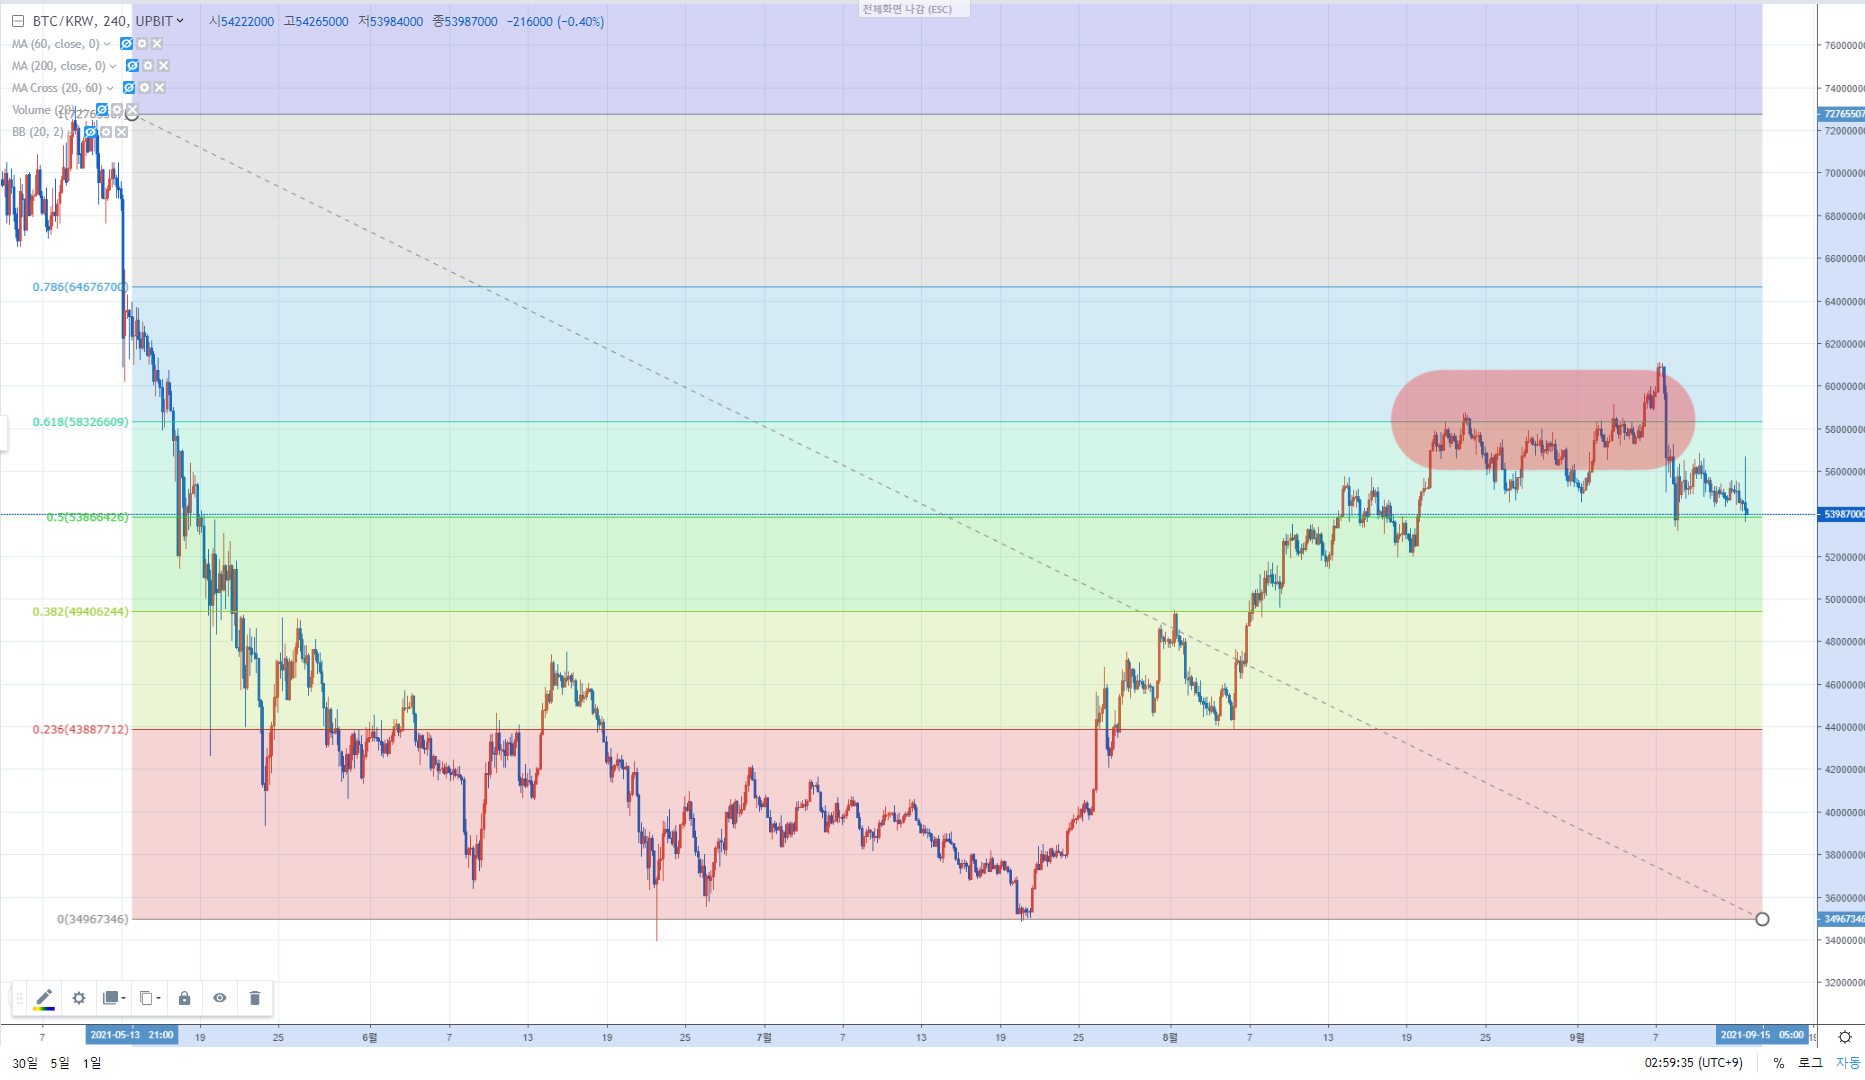
◆ 0.618 section resistance
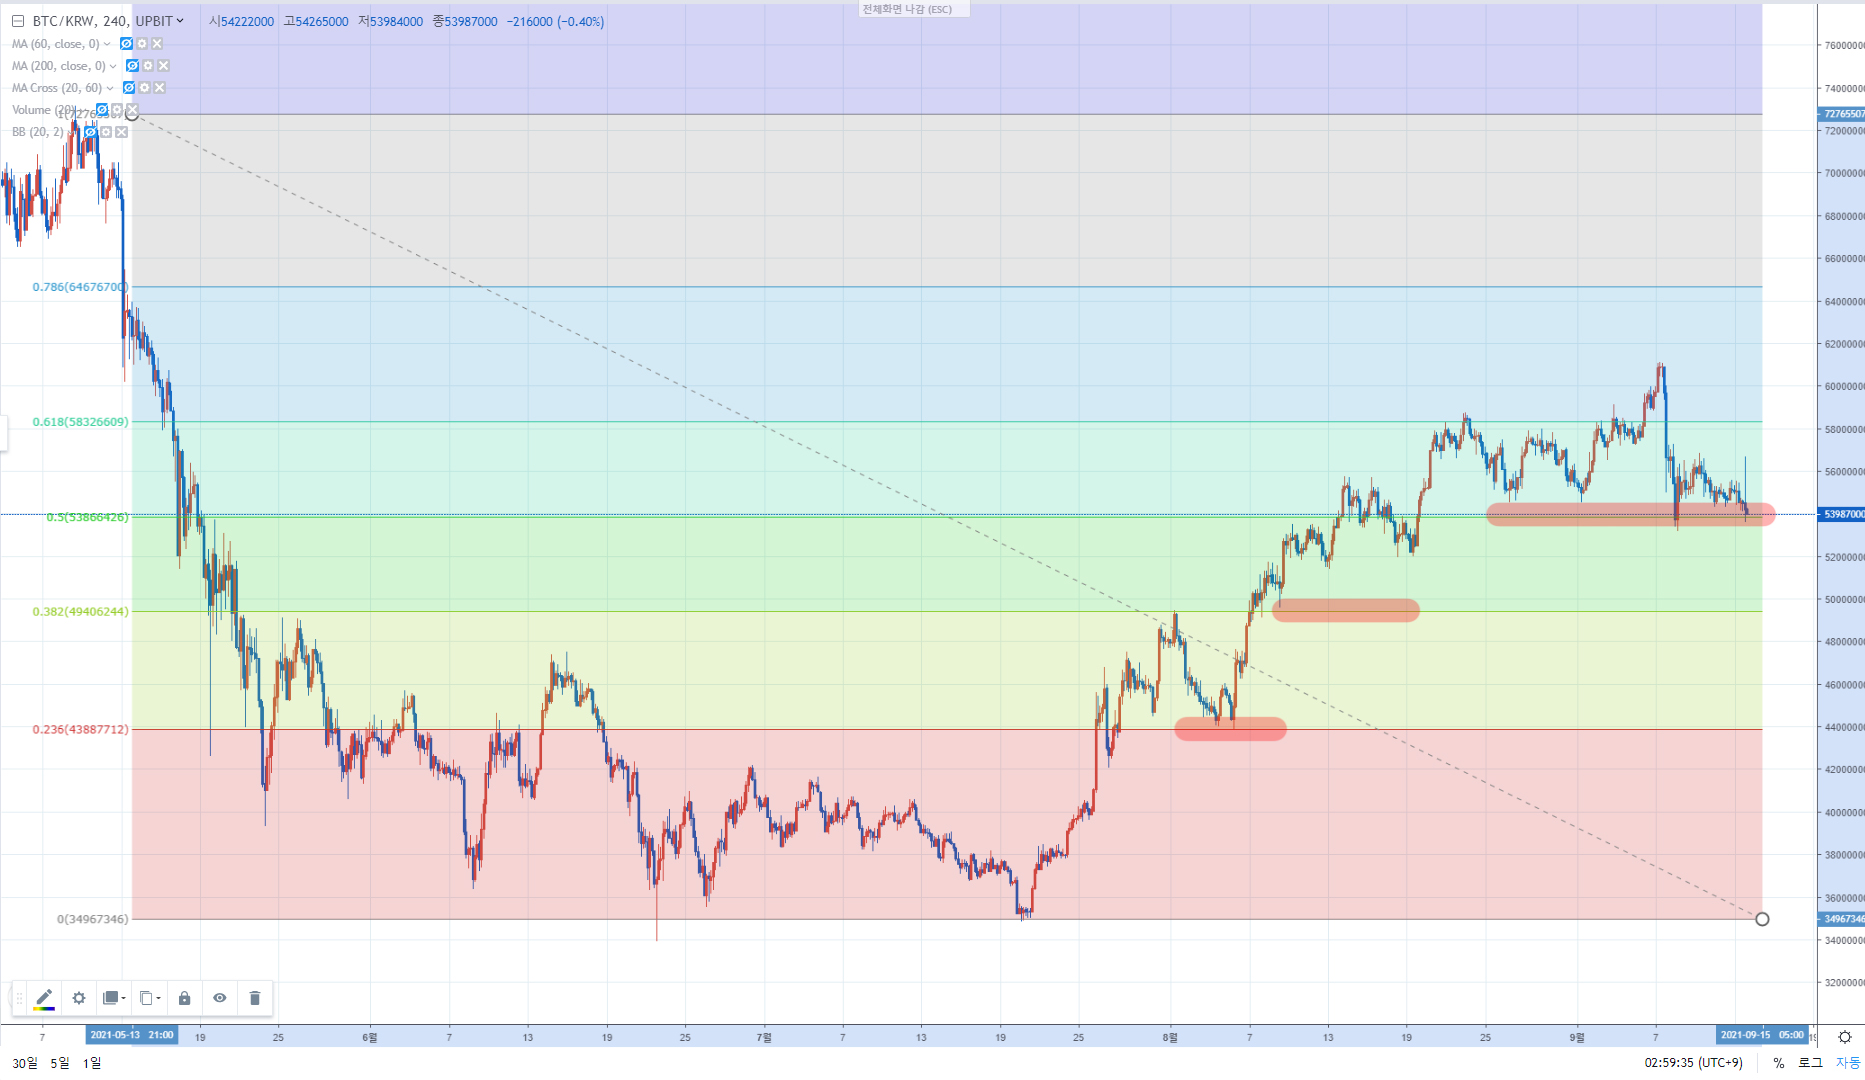
◆ Act as a support line after breaking through each section
Summary
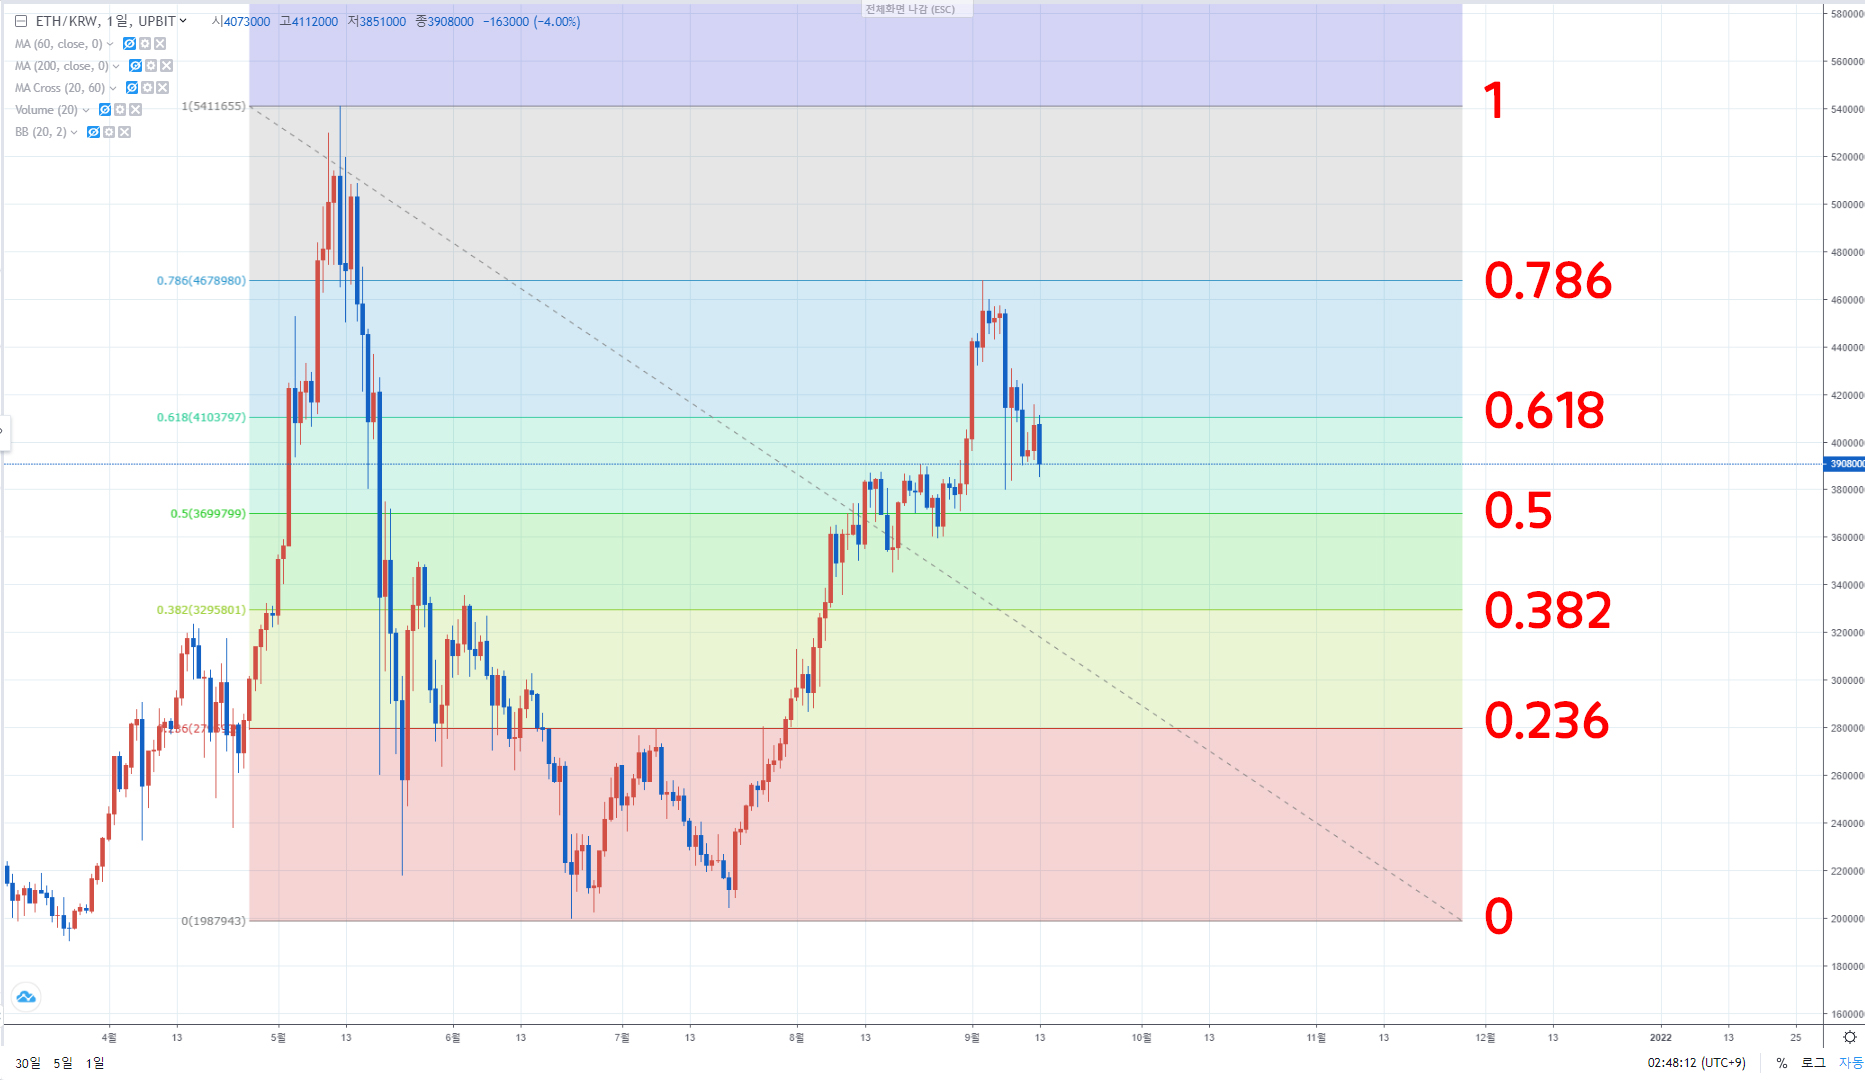
A retracement (rebound or correction) may come in the 38.2% / 61.8% ratio range.
Buy when the rebound starts and sell when the correction starts.
|
2021년 해외코인거래소 순위 및 추천 |
|||
|
|
|
|
|
|
거래량 |
11조(1위) |
3.5조 |
9.5조 |
|
레버리지 |
최대100배 |
최대100배 |
최대125배 |
|
수수료 |
- 지정가 : 0.02% - 시장가 : 0.04%(1위) |
- 지정가 : -0.025% - 시장가 : 0.075% |
- 지정가 : -0.025% - 시장가 : 0.075% |
|
거래방법 |
현물+선물+마진 |
선물+주식+FOREX |
선물 |
|
회원가입
|
|||
|
할인코드
|
|||


