
| 2021년 해외코인거래소 순위 및 추천 | |||
 |
 |
 |
|
| 거래량 | 11조(1위) | 1조 | 3.4조 |
|---|---|---|---|
| 레버리지 | 최대100배 | 최대100배 | 최대125배 |
| 수수료 | - 지정가 : 0.02% - 시장가 : 0.04%(1위) |
- 지정가 : -0.025% - 시장가 : 0.075% |
- 지정가 : -0.025% - 시장가 : 0.075% |
| 거래방법 | 현물+선물+마진 | 선물+주식+FOREX | 선물 |
| 회원가입 | 회원가입 | 회원가입 | 회원가입 |
| 할인코드 | 20% 할인 | 5% 할인 | 20% 할인 |
Trading View Trend line
2019.06.09 05:39
Trading View Trend line
Hello everyone
This time, we will learn how to draw a trend line in Trading View.
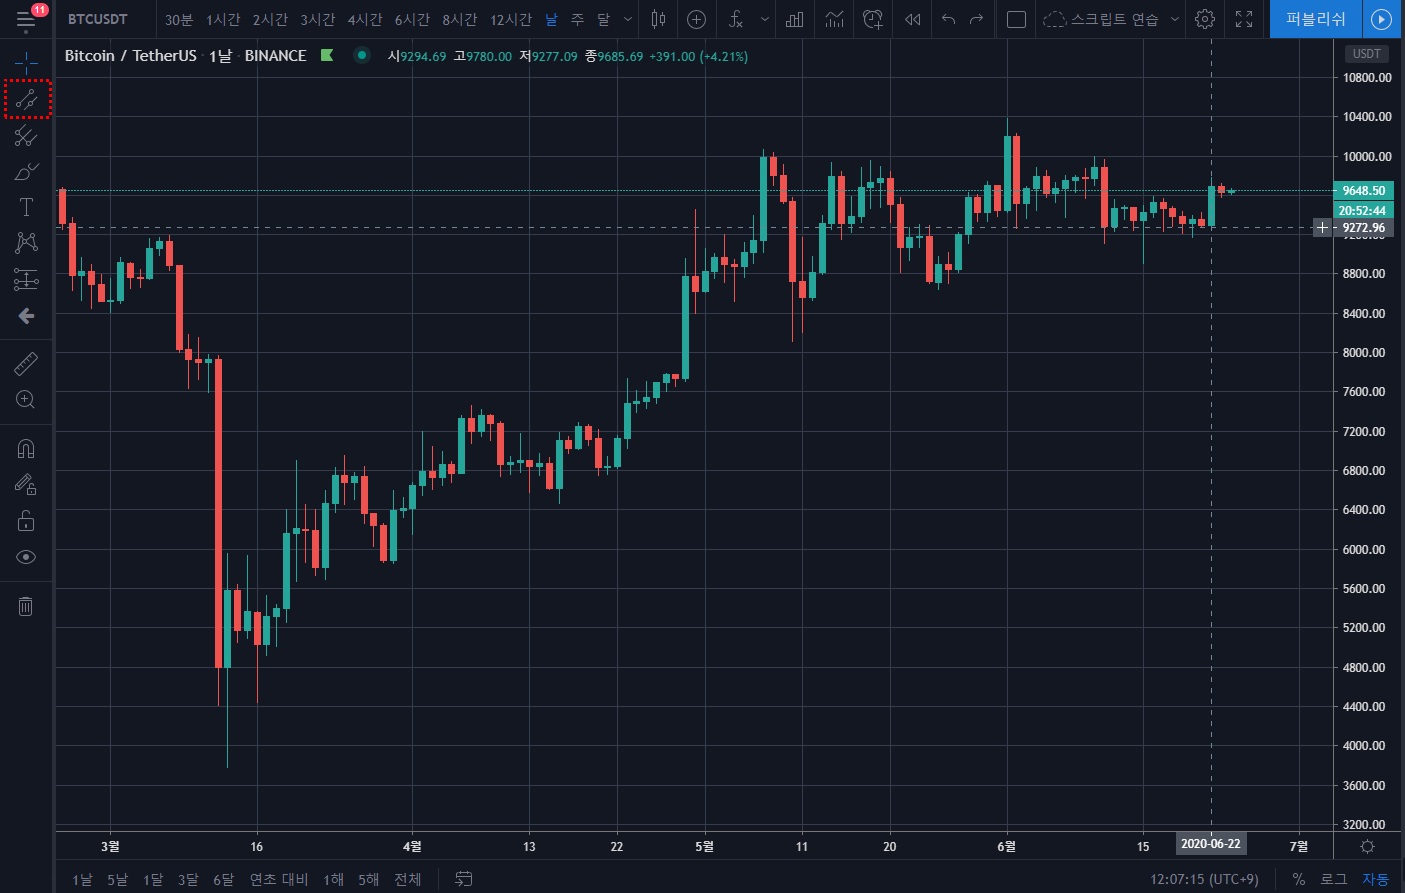
Please enter the Trading View Chart first.
Now click the icon in the red box on the left!
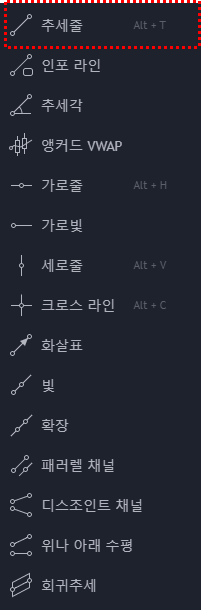
You will then see a list like the one above.
Just select the trend line you want and draw it on the chart!
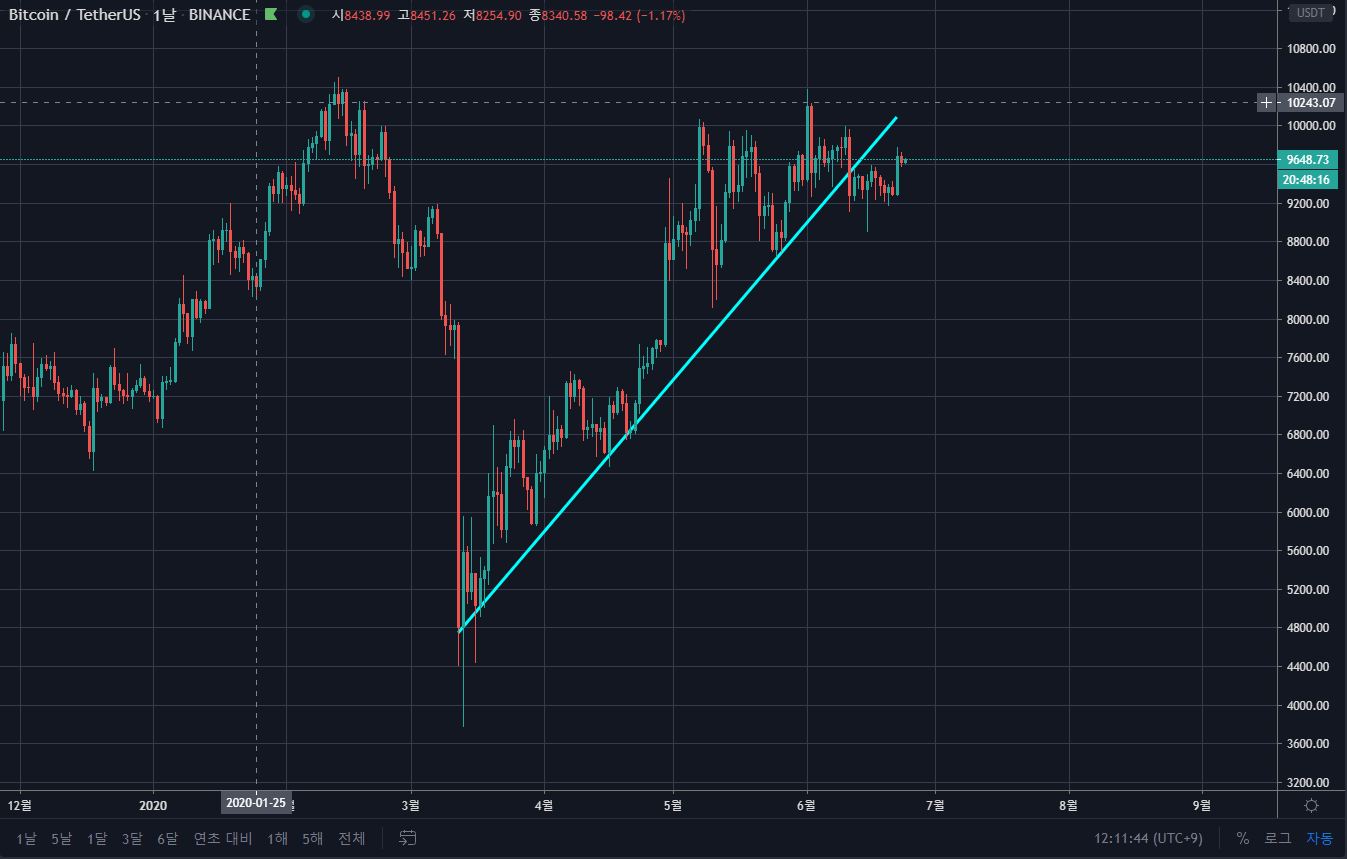
There is a way to see the trend by connecting the lows with this basic trend line.
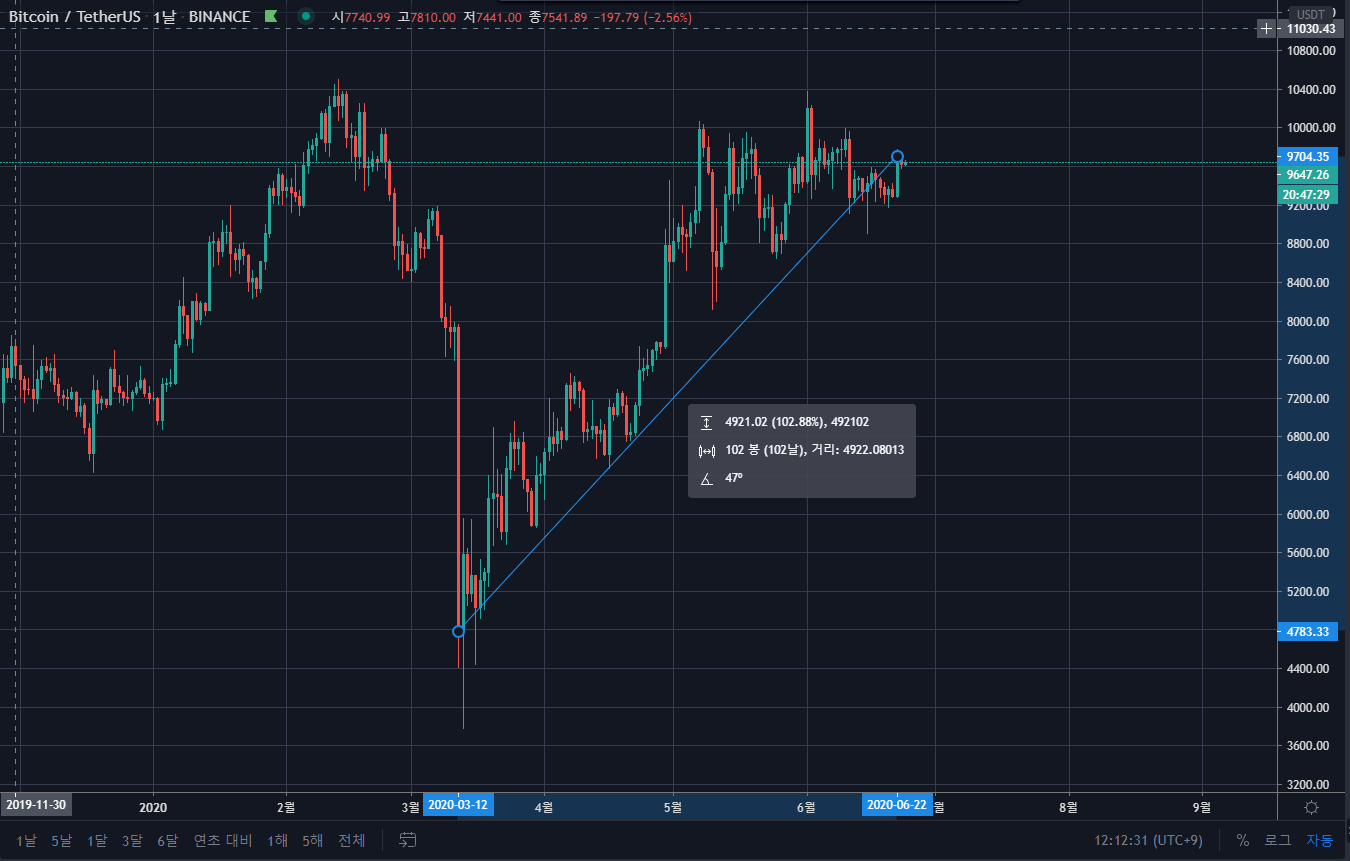
You can also plot trends and get more information using a feature called "Infoline".
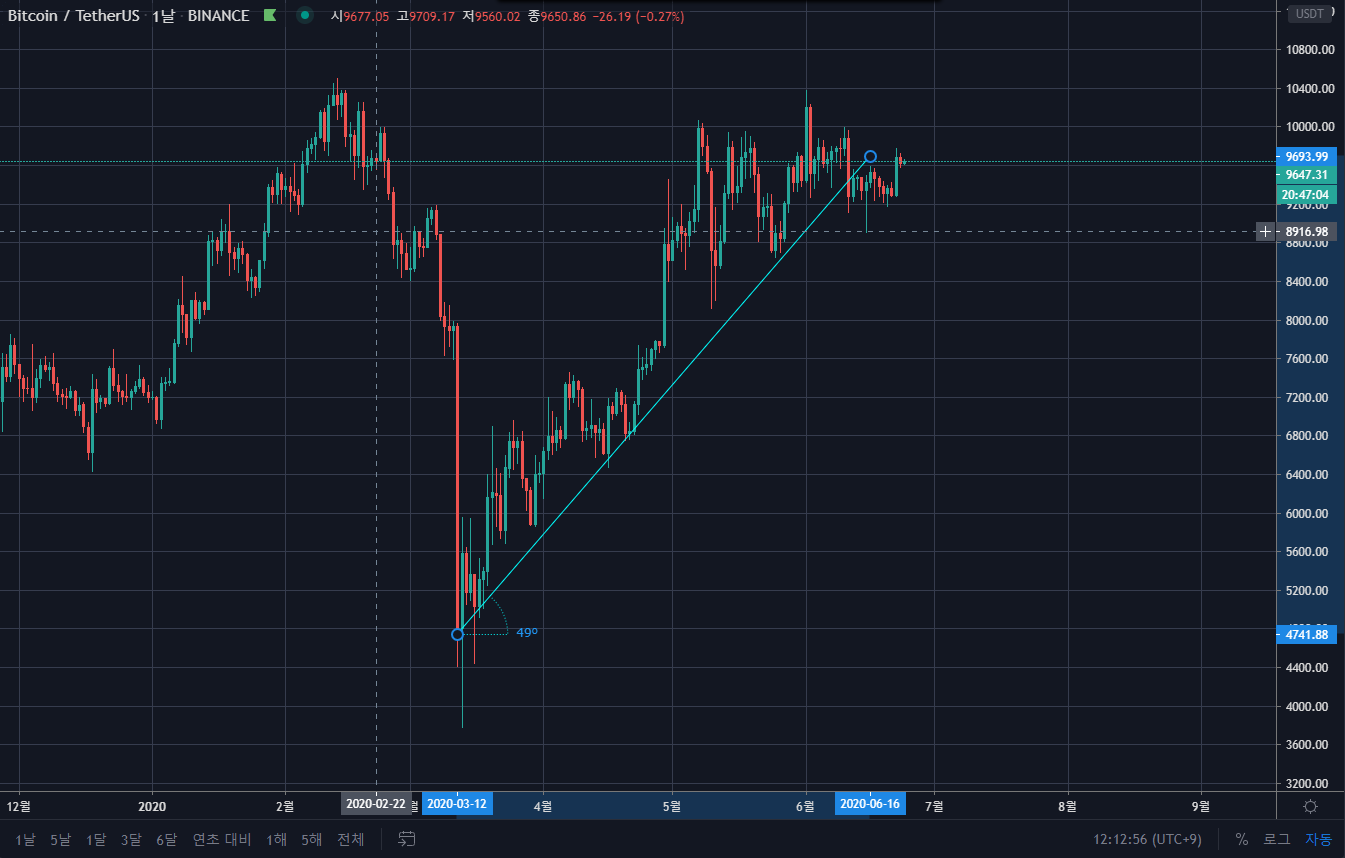
Also, you can measure the angle with "trend angle" as above ^^
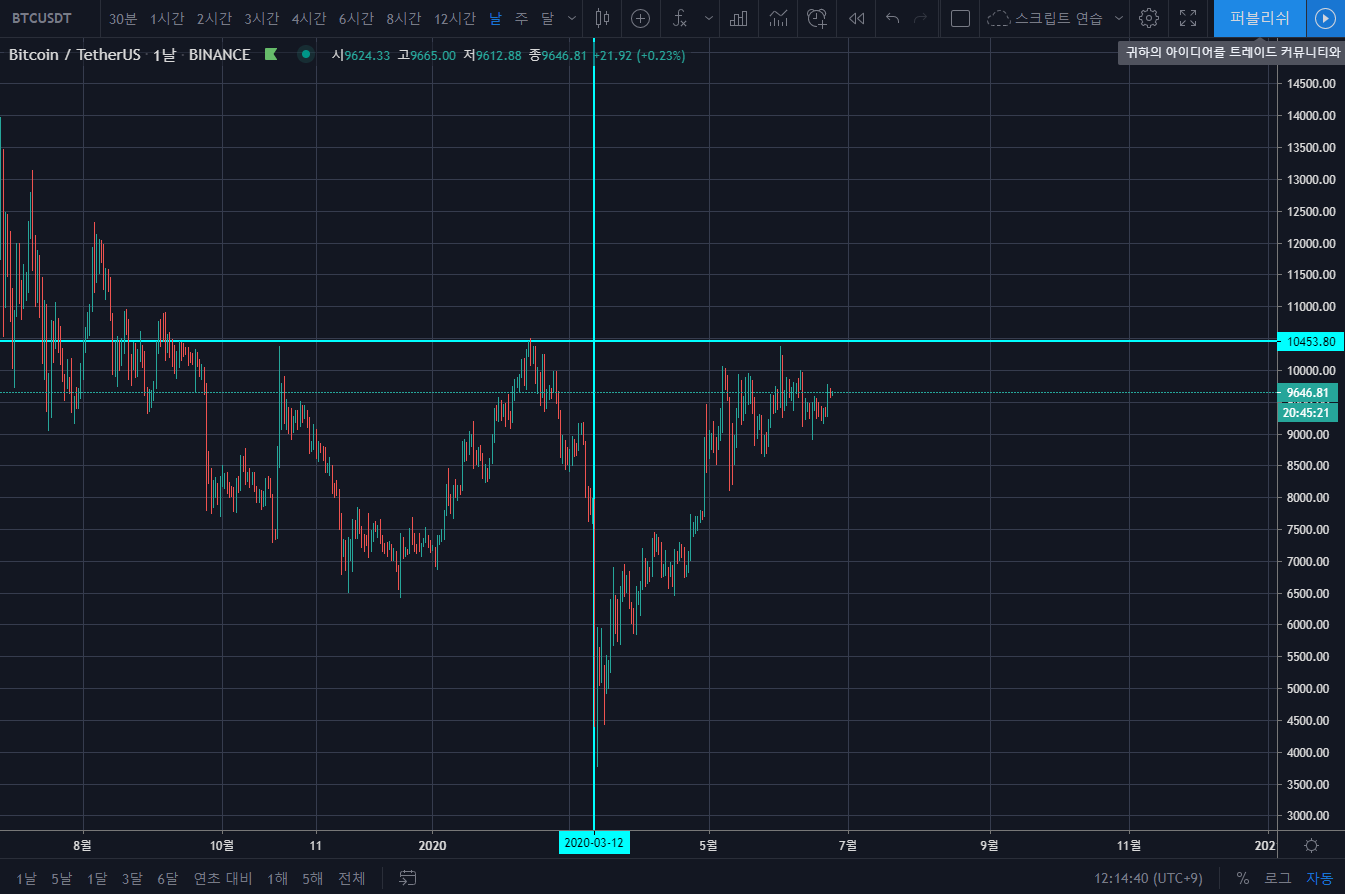
Since there are vertical and horizontal lines, you can draw support resistance with horizontal lines.
The vertical line can be used according to a specific date (eg gift expiry).
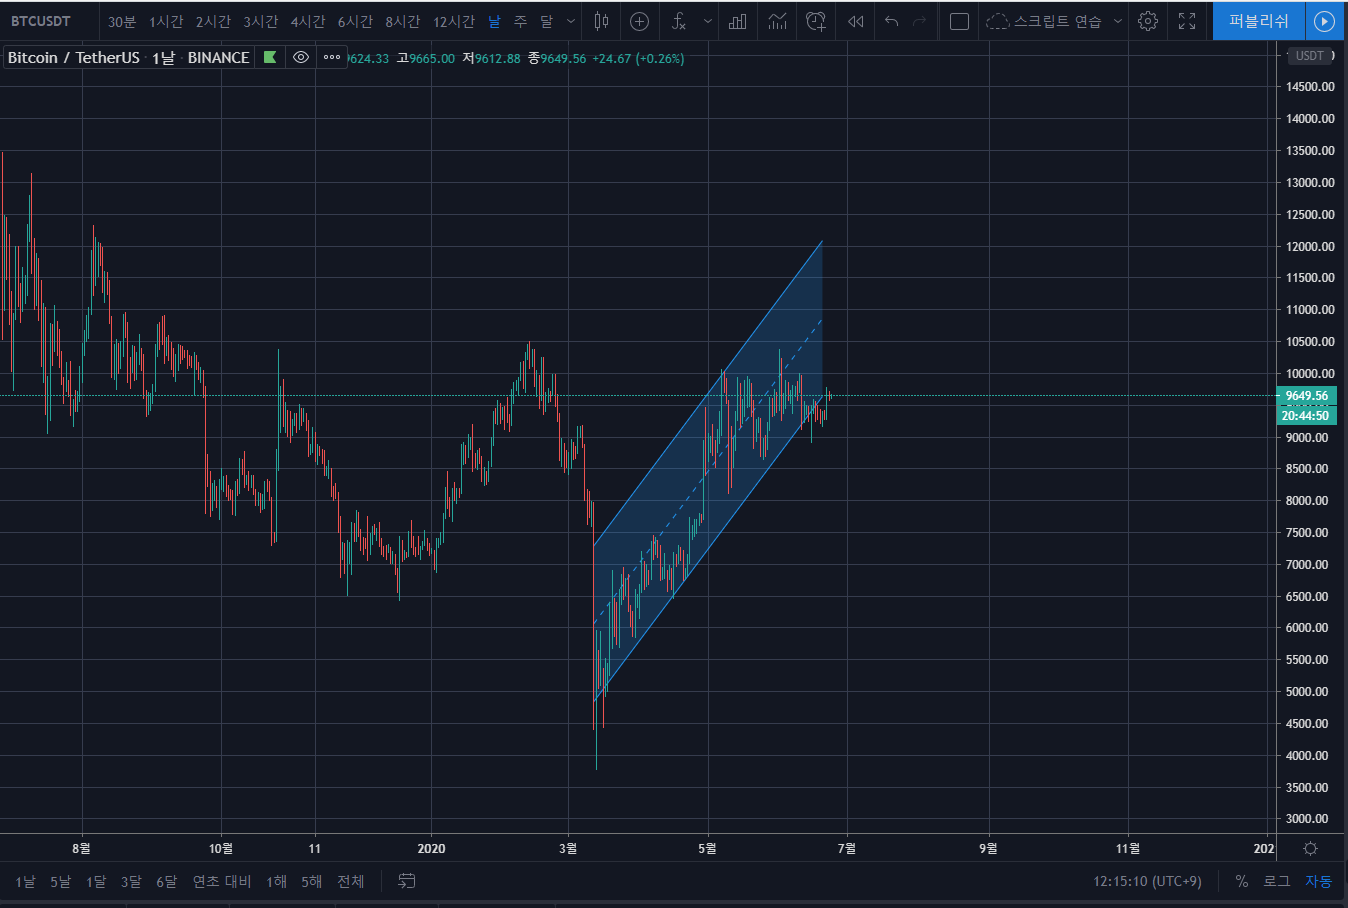
You can also draw parallel lines.
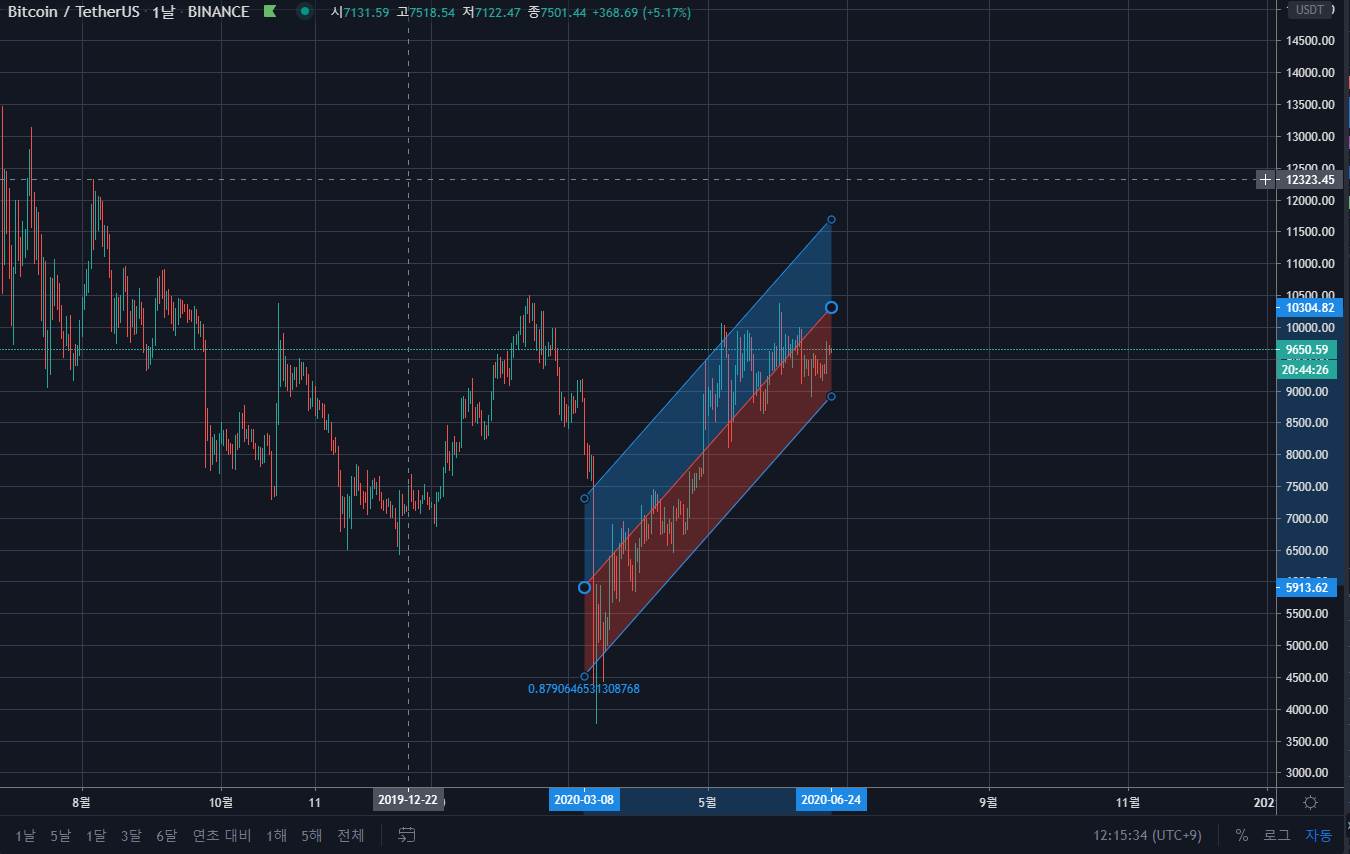
You can also draw a mean regression line!
I have no doubt that it will be a very good tool~!
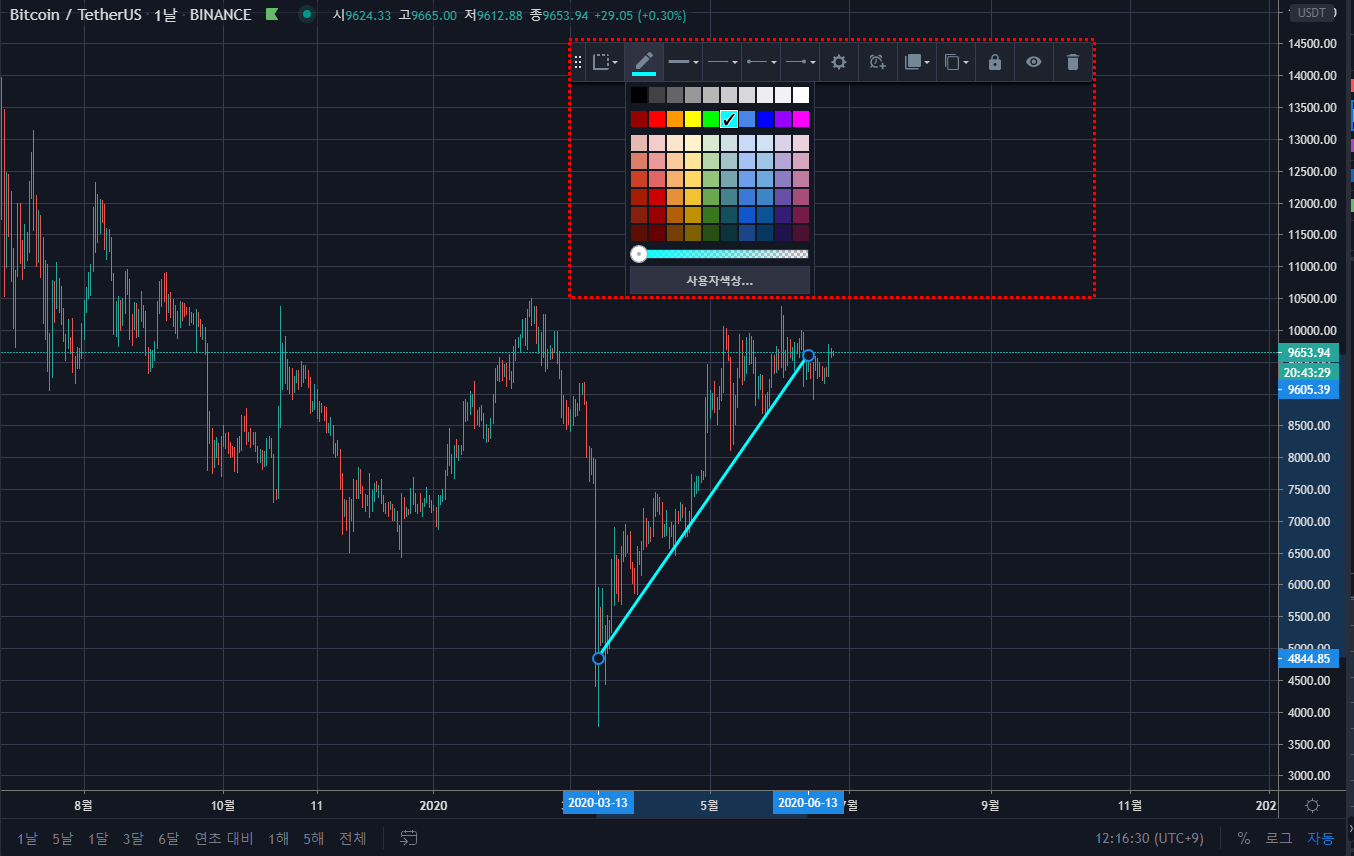
After drawing a line, a small toolbox appears automatically, supporting various functions such as the desired color, line thickness, and alarm setting.
Summary :
1. Run the chart
2. Click the trend line icon on the left
3. Select the desired line
4.Use according to your taste
It's over. It's simple, isn't it?
Trading View Toolbox provides simple and good tools as well as smooth HTS!
So, let's wrap up our introduction to the ideal Trading View trendline!
